 paper slide size, multilayer (picture)_002")
 paper slide size, multilayer (picture)_001")
 paper slide size, multilayer (picture)_003")
 paper slide size, multilayer (picture)_004")
 paper slide size, multilayer (picture)_005")
 paper slide size, multilayer (picture)_006")
 paper slide size, multilayer (picture)_007")
 paper slide size, multilayer (picture)_008")
 paper slide size, multilayer (picture)_009")
 paper slide size, multilayer (picture)_010")
 paper slide size, multilayer (picture)_011")
 paper slide size, multilayer (picture)_012")
 paper slide size, multilayer (picture)_013")
 paper slide size, multilayer (picture)_014")
 paper slide size, multilayer (picture)_015")
 paper slide size, multilayer (picture)_016")
 paper slide size, multilayer (picture)_017")
 paper slide size, multilayer (picture)_018")
 paper slide size, multilayer (picture)_019")
 paper slide size, multilayer (picture)_020")
 paper slide size, multilayer (picture)_021")
 paper slide size, multilayer (picture)_022")
 paper slide size, multilayer (picture)_023")
 paper slide size, multilayer (picture)_024")
 paper slide size, multilayer (picture)_025")
 paper slide size, multilayer (picture)_026")
 paper slide size, multilayer (picture)_027")
 paper slide size, multilayer (picture)_028")
 paper slide size, multilayer (picture)_029")
 paper slide size, multilayer (picture)_030")
 paper slide size, multilayer (picture)_031")
 paper slide size, multilayer (picture)_032")
 paper slide size, multilayer (picture)_033")
 paper slide size, multilayer (picture)_034")
 paper slide size, multilayer (picture)_035")
Short review
Introducing a unique product – The Best World Map for PowerPoint. Sounds presumptuous, right?
But, judge for yourself:
Three options for detail
Multilayering: 27 or more layers in each presentation
6 slide size options
Detailed names for all objects in alphabetical order
68 or more built-in vector backgrounds
7 or more unique and very practical color schemes built into the presentation
And much more…
This is not a template, but a tool for creating world maps of any complexity and detail. This tool was originally created to maximize the power of PowerPoint, the ability to edit any object on a slide, and, as much as possible, comfortable work in this program.
For the convenience and productivity of your work, this tool fully uses the capabilities of such PowerPoint tools and functions as Selection Pane, Slide Master, Layouts, Themes, Color schemes, and many others.
This tool uses only vector objects in order to provide the ability to edit any object.
Many layers allow you to form almost any world map. In addition to the main layer (land), this product contains the following layers: main roads, main railways, rivers, lakes, capitals of states, graticule, seas, oceans, straits, bays, and various text layers (for example, the names of states and territories, capitals, seas, oceans, rivers, lakes, etc.)
This tool will be useful not only in business, consulting, and education. Such ample opportunities make it possible to actively use it in design and in all similar areas of activity. And the highest quality standards allow this product to be used for professional purposes – for designers, layout designers, editors, etc. Therefore, this product will be very useful not only for ordinary PowerPoint users but also for professionals who create / edit presentations for their customers. It’s a must-have tool for anyone who occasionally creates or edits presentations. It is a must-have for both a novice PowerPoint user and a professional.
We really hope that this tool will be most useful for you and that working with it will bring you satisfaction. Thanks!
Good news for Office 2019 and Office 365 users
The world map in The Best World Map for PowerPoint has no data link, but Office 2019 and Office 365 have a Map chart that can use and display a variety of data.
We are glad to inform you that all layers from The Best World Map for PowerPoint can be used in conjunction with a Map chart. You can use Map chart as Main Layer together with other layers.
In order to combine a Map Chart and layers from The Best World Map for PowerPoint, you need to follow a few simple steps:
1. On The Best World Map for PowerPoint to select, group, and copy the layers you need, including the Main Layer.
2. On the slide with the Map chart, you need to set the Robinson projection (at the moment only this projection is available in The Best World Map for PowerPoint) for the world map.
3. Paste on the slide containing the Map chart the previously grouped and copied layers from The Best World Map for PowerPoint.
4. Scaling and slightly changing the proportions of this group of layers, combine them with the Map chart. In this case, it is necessary to align this group of layers with Map chart exactly on the Main Layer.
5. After completing the alignment, you can delete the Main Layer or hide it. Now the Map chart can be used as the Main Layer. For the convenience of working with the Map chart, you can temporarily hide other layers. If you are using text layers, you may need to increase or decrease the font size in those layers.
Compatibility and specifications
This product is compatible with all versions of Office (and therefore PowerPoint versions) starting from Office 2007. It is most productive when used with Office 2016 and higher. This does not mean that the product and its features will not work in Office 2007, Office 2010, and Office 2013. Everything works. But for the best efficiency and user experience, we recommend using Office 2016 or higher.
When creating this tool, we did not use new features that are included in Office 365 and Office 2019, but which are not, for example, in Office 2016. This is done for the greatest possible compatibility.
All this applies to versions of Office for Windows and Mac OS. Unfortunately, we do not offer versions for Keynote or Google Docs yet. But we’ll add Keynote versions in the future. At the moment, we don’t see the need to add a Google Docs version.
Taking into account the general trends in the development of programs for creating presentations, we believe that the relevance (compatibility) of our products is guaranteed for many years to come. However, we are not going to stop there. We plan to update each product at least once a year, as often as possible.
Maps with a high level of detail require more resources on your computer. The more detail, the more powerful the computer is required. Nevertheless, according to our tests, even on 10-year-old computers, high-detail maps work fine (there are only slight delays with the program’s response during some operations).
At the same time, the level of map detail (complexity of vector objects) is not the main consumer of your computer’s resources. The speed of PowerPoint is much more dependent not on the complexity of the objects on the slide (although this too), but their number. For example, this map has layers containing 1860 objects. Including there is a layer in which these 1860 objects are rather complex vector objects. That’s quite a lot. Regardless, you will have no problem working in PowerPoint. Only on very weak computers can there be noticeable delays in the response of the program when working with many complex vector objects. We have tried to minimize possible delays in the program as much as possible. For this, each object was optimized (nodes were simplified and their number was reduced to the required minimum) and all objects were collected into groups (layers). That is why (but not only why) we recommend that you work with groups (layers) without ungrouping them. If necessary, you can work with individual objects in a group without ungrouping it.
Please note that some effects may give unexpected results due to the high complexity of some objects. This is especially true for objects with high detail. For example, if you want to apply a Bevel effect, it might be better to choose a low detail map option. Differences in the complexity of some objects are highly dependent on the level of detail. For example, in this tool, the low detail US outline has 82 nodes, normal detail has 190 nodes, and high detail has 645 nodes. Or, for example, a Whole World contour with low detail is 1959 nodes, normal detail is 5034 nodes, and high detail is 18207 nodes.
Step 1. Select the layer (group) you need. This can be done by clicking on the layer or selecting the layer in the Selection Pane.

Step 2. You can change the properties of the layer (group) as a whole. For example like this:

Step 3. You can select a separate object without ungrouping the layer (group). To do this, click on the object you need or select it in the Selection Pane. At the moment of selecting an individual object, the layer (group) must be selected.
Step 4. Now you can change the properties of an individual object without ungrouping the layer (group). For example like this:
Note: you can simultaneously change the properties of several objects in a layer (group) without ungrouping the layer (group). To do this, you must select objects on the slide (with a selected layer (group)) holding down Shift or select the objects you need in the Selection Pane while holding down Ctrl.
Applications of the product
The Best World Map for PowerPoint is applicable to almost any field.
For example, in business, it will be relevant both for global companies and for small local companies (for example, to show global trends or show some locations in relation to global trends). It is very convenient and provides the broadest possibilities for the professional presentation of information.
In consulting, this map is indispensable for analyzing and demonstrating global trends. For the best and most visual presentation of information with huge possibilities of professional design and showing the client the highest level of your competence.
In education, it provides ample opportunities to demonstrate a wide variety of aspects and provides excellent material on a wide variety of topics. Very simple and intuitive. And with almost limitless design possibilities.
Also in any other area – any business, education, cognitive and entertainment needs, etc. – this map will be indispensable as a professional tool for presenting the information. In our global world, such a map is irreplaceable.
Projection
Currently, the Best World Map for PowerPoint is presented in only one projection – Robinson.
 We’ve slightly modified this projection to make the map easier to use in PowerPoint. Namely: the map is slightly shifted to the left of the center and the boundaries of the objects Alaska and Russia are not cut as in the usual Robinson projection but are indivisible objects (which is why Alaska is slightly outside the projection boundaries).
Soon, we plan to present for you maps in the projections of Mercator, Equirectangular and Orthographic.

Level of detail
The Best World Map for PowerPoint comes in three levels of detail: Low, Normal, and High
Low detail
 A lower level of detail means smoother curves (fewer nodes) in objects and fewer objects themselves. This achieves two goals: virtually no lag when working in PowerPoint with these maps, and a minimal presentation file size.
Use maps with a minimum level of detail if you need to make a presentation very quickly and it is mainly intended for the demonstration on a small screen, and also if you need to mail the presentation to many recipients.
Normal detail
 A normal level of detail is the most balanced option. A combination of sufficient detail (in the vast majority of cases, this detail is higher than any vector world map for PowerPoint that you can find) and a relatively small presentation file size. When working with a map with normal detail, occasionally there may be slight delays in PowerPoint’s response on very slow computers. The map has a lot more detail and more objects (for example, countries and territories) and, accordingly, it looks much more authentic.
You can use maps with a normal level of detail in any situation – both for viewing on a screen of any size and for printing.
High detail
 A high level of detail is a level of detail without compromise; it is detail at the limit of PowerPoint’s capabilities. Of course, we can make a map with even greater detail, but in this case, PowerPoint will slow down even on your very powerful computer. Therefore, maximum detail is the best option at the limit of PowerPoint’s capabilities with the most detailed objects and the most objects (for example, 250 countries and territories). Such a map looks very authentic and inspires confidence.
You can use a high-detail world map for any range of tasks – displaying on a screen of any size and printing (especially important for large formats). If you use multiple instances of the world map in high detail in your presentation, this can result in a rather large presentation file size. If you want the best possible quality, use a high-detail world map.
Basic, Standard and Premium
The Best World Map for PowerPoint is currently available only in the Basic version. Standard and Premium options are coming soon.
Basic is the minimum required set of slides (from 35 to 38 slides), the minimum set of layers (from 27 to 30 layers), the minimum set of built-in vector backgrounds (68 backgrounds), and the minimum set of color schemes built into the presentation (7 color schemes).
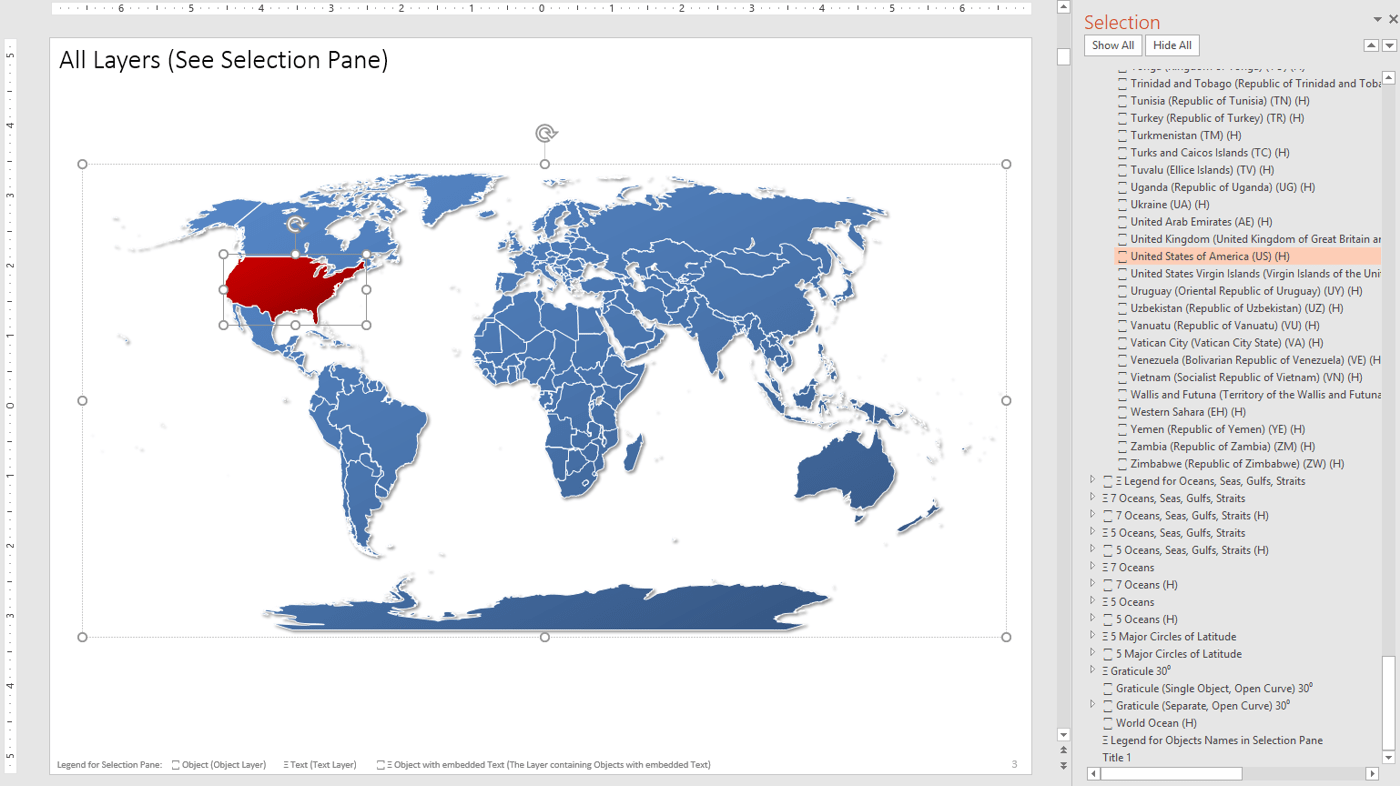
Multilayering
The Best World Map for PowerPoint is unique primarily for its multilayering.
Strictly speaking, there is no concept of a “layer” in PowerPoint. But groups of objects can be used as layers thanks to the wonderful Selection Pane tool.
In the Selection Pane, you can turn on / off the display of layers / objects, select individual layers / objects, select multiple layers / objects, edit the names of layers / objects, etc. Using the selection in the Selection Pane, you can edit the properties of not only individual objects (without ungrouping the layer), but also the properties of individual layers or properties of several layers at the same time.
Below is an example for PowerPoint 2016. In other versions of PowerPoint, everything works the same.
1. If no object/objects/group is selected.

2. If an object/objects/group is selected.

3. The easiest and fastest way to show Selection Pane: Alt-F10
A few tips for working with the Selection Pane:
1. After opening the presentation file, all groups (layers) are presented in the Selection Pane in an expanded form. If you want to operate at the layer (group) level, then collapse all groups. To do this, click on the triangle to the left of the layer (group) name.
2. If you do not see some of the information in the Selection Pane, then increase the width of the Selection Pane (to do this, click on the left border of the panel and drag it to the left). Or use the slider at the bottom.
3. You can move layers (groups) up or down using the arrows in the upper right corner of the panel.
4. You can also change the hierarchy of layers (groups) by dragging and dropping them. To do this, left-click on the layer (group) and hold down the button, move the layer (group) to the level you need.
5. You can move the Selection Pane to the left side of the PowerPoint window, or anywhere else. To do this, left-click at the top of the panel, and while holding down the button, move the panel to the desired location. To dock the panel to the right or left, move the cursor to the right or left edge of the PowerPoint window.
6. To be able to quickly determine what type a layer (group) or an individual object belongs to, all names begin with special characters:
꙱ – layer (group) consists of a graphic (vector) objects
Ξ – is the text layer (group)
꙱ Ξ – layer (group) consists of vector objects with embedded text
7. Unfortunately, text search does not work in the Selection Pane. But you can quickly find the desired object by name because all objects in layers (groups) are arranged alphabetically (with rare exceptions).
To the right of the names of layers (groups), there is an “eye” icon if the layer is shown or a short line icon if the layer is hidden. Click on the icon to hide or show the layer (group). If the icon is not visible, move the slider at the bottom of the panel to the right or increase the width of the panel.
To select a layer (group) or an individual object, click on its name once. The corresponding layer (group) or object will be selected on the slide.
To select multiple layers (groups) click on the group (layer) and then press Ctrl and hold it. Then click on the names of other layers (groups). When you’re done with the selection, release the Ctrl key. The corresponding layers (groups) are now highlighted on the slide and you can edit their general properties.
In the same way, you can select individual objects, but only within the same group. Objects belonging to different groups (layers) cannot be selected together.
| # | Layer Name | Number of Objects | Detail Level | Basic | Standard | Premium |
| 1 | World Ocean | 1 | H | √ | √ | √ |
| 2 | World Ocean | 1 | N | √ | √ | √ |
| 3 | World Ocean | 1 | L | √ | √ | √ |
| 4 | World Ocean (w/o Cont.) | 1 | H | √ | ||
| 5 | World Ocean (w/o Cont.) | 1 | N | √ | ||
| 6 | World Ocean (w/o Cont.) | 1 | L | √ | ||
| 7 | Graticule (Sep., OC) 15⁰ | 38 | HNL | √ | √ | |
| 8 | Graticule (Sng.Obj., OC) 15⁰ | 1 | HNL | √ | √ | |
| 9 | Graticule (Sep., CC) 15⁰ | 38 | HNL | √ | √ | |
| 10 | Graticule (Sng.Obj., CC) 15⁰ | 1 | HNL | √ | √ | |
| 11 | Graticule 15⁰ | 74 | HNL | √ | √ | |
| 12 | Graticule (Sep., OC) 30⁰ | 20 | HNL | √ | √ | √ |
| 13 | Graticule (Sng.Obj., OC) 30⁰ | 1 | HNL | √ | √ | √ |
| 14 | Graticule (Sep., CC) 30⁰ | 20 | HNL | √ | √ | √ |
| 15 | Graticule (Sng.Obj., CC) 30⁰ | 1 | HNL | √ | √ | √ |
| 16 | Graticule 30⁰ | 38 | HNL | √ | √ | √ |
| 17 | 5 Major Circles of Latitude | 5 | HNL | √ | √ | √ |
| 18 | 5 Major Circles of Latitude | 5 | HNL | √ | √ | √ |
| 19 | 5 Oceans | 5 | H | √ | √ | √ |
| 20 | 5 Oceans | 5 | N | √ | √ | √ |
| 21 | 5 Oceans | 5 | L | √ | √ | √ |
| 22 | 5 Oceans | 6 | HNL | √ | √ | √ |
| 23 | 5 Oceans | 5 | H | √ | √ | |
| 24 | 5 Oceans | 5 | N | √ | √ | |
| 25 | 5 Oceans | 5 | L | √ | √ | |
| 26 | 7 Oceans | 7 | H | √ | √ | √ |
| 27 | 7 Oceans | 7 | N | √ | √ | √ |
| 28 | 7 Oceans | 7 | L | √ | √ | √ |
| 29 | 7 Oceans | 9 | HNL | √ | √ | √ |
| 30 | 7 Oceans | 7 | H | √ | √ | |
| 31 | 7 Oceans | 7 | N | √ | √ | |
| 32 | 7 Oceans | 7 | L | √ | √ | |
| 33 | 5 Oceans, Seas, Gulfs, … | 103 | H | √ | √ | √ |
| 34 | 5 Oceans, Seas, Gulfs, … | 103 | N | √ | √ | √ |
| 35 | 5 Oceans, Seas, Gulfs, … | 103 | L | √ | √ | √ |
| 36 | 5 Oceans, Seas, Gulfs, … | 104 | HNL | √ | √ | √ |
| 37 | 5 Oceans, Seas, Gulfs, … | 103 | H | √ | √ | |
| 38 | 5 Oceans, Seas, Gulfs, … | 103 | N | √ | √ | |
| 39 | 5 Oceans, Seas, Gulfs, … | 103 | L | √ | √ | |
| 40 | 7 Oceans, Seas, Gulfs, … | 105 | H | √ | √ | √ |
| 41 | 7 Oceans, Seas, Gulfs, … | 105 | N | √ | √ | √ |
| 42 | 7 Oceans, Seas, Gulfs, … | 105 | L | √ | √ | √ |
| 43 | 7 Oceans, Seas, Gulfs, … | 107 | HNL | √ | √ | √ |
| 44 | 7 Oceans, Seas, Gulfs, … | 105 | H | √ | √ | |
| 45 | 7 Oceans, Seas, Gulfs, … | 105 | N | √ | √ | |
| 46 | 7 Oceans, Seas, Gulfs, … | 105 | L | √ | √ | |
| 47 | Legend for Oceans, Seas, … | 5 | HNL | √ | √ | √ |
| 48 | Whole World | 1 | H | √ | √ | √ |
| 49 | Whole World | 1 | N | √ | √ | √ |
| 50 | Whole World | 1 | L | √ | √ | √ |
| 51 | Whole World (w/o Lakes) | 1 | H | √ | √ | √ |
| 52 | Whole World (w/o Lakes) | 1 | N | √ | √ | √ |
| 53 | Whole World (w/o Lakes) | 1 | L | √ | √ | √ |
| 54 | Whole World (w/o Ant.) | 1 | H | √ | √ | √ |
| 55 | Whole World (w/o Ant.) | 1 | N | √ | √ | √ |
| 56 | Whole World (w/o Ant.) | 1 | L | √ | √ | √ |
| 57 | Whole World (w/o Ant. and Lakes) | 1 | H | √ | √ | √ |
| 58 | Whole World (w/o Ant. and Lakes) | 1 | N | √ | √ | √ |
| 59 | Whole World (w/o Ant. and Lakes) | 1 | L | √ | √ | √ |
| 60 | 7 Cont. | 7 | H | √ | √ | √ |
| 61 | 7 Cont. | 7 | N | √ | √ | √ |
| 62 | 7 Cont. | 7 | L | √ | √ | √ |
| 63 | 7 Cont. | 7 | HNL | √ | √ | √ |
| 64 | 7 Cont. | 7 | H | √ | √ | |
| 65 | 7 Cont. | 7 | N | √ | √ | |
| 66 | 7 Cont. | 7 | L | √ | √ | |
| 67 | 6 Cont. (Eurasia) | 6 | H | √ | √ | √ |
| 68 | 6 Cont. (Eurasia) | 6 | N | √ | √ | √ |
| 69 | 6 Cont. (Eurasia) | 6 | L | √ | √ | √ |
| 70 | 6 Cont. (Eurasia) | 6 | HNL | √ | √ | √ |
| 71 | 6 Cont. (Eurasia) | 6 | H | √ | √ | |
| 72 | 6 Cont. (Eurasia) | 6 | N | √ | √ | |
| 73 | 6 Cont. (Eurasia) | 6 | L | √ | √ | |
| 74 | 6 Cont. (America) | 6 | H | √ | √ | √ |
| 75 | 6 Cont. (America) | 6 | N | √ | √ | √ |
| 76 | 6 Cont. (America) | 6 | L | √ | √ | √ |
| 77 | 6 Cont. (America) | 7 | HNL | √ | √ | √ |
| 78 | 6 Cont. (America) | 6 | H | √ | √ | |
| 79 | 6 Cont. (America) | 6 | N | √ | √ | |
| 80 | 6 Cont. (America) | 6 | L | √ | √ | |
| 81 | 5 Cont. (w/o Ant.) | 5 | H | √ | √ | √ |
| 82 | 5 Cont. (w/o Ant.) | 5 | N | √ | √ | √ |
| 83 | 5 Cont. (w/o Ant.) | 5 | L | √ | √ | √ |
| 84 | 5 Cont. (w/o Ant.) | 6 | HNL | √ | √ | √ |
| 85 | 5 Cont. (w/o Ant.) | 5 | H | √ | √ | |
| 86 | 5 Cont. (w/o Ant.) | 5 | N | √ | √ | |
| 87 | 5 Cont. (w/o Ant.) | 5 | L | √ | √ | |
| 88 | 4 Cont. (Afro-Eurasia) | 4 | H | √ | √ | √ |
| 89 | 4 Cont. (Afro-Eurasia) | 4 | N | √ | √ | √ |
| 90 | 4 Cont. (Afro-Eurasia) | 4 | L | √ | √ | √ |
| 91 | 4 Cont. (Afro-Eurasia) | 5 | HNL | √ | √ | √ |
| 92 | 4 Cont. (Afro-Eurasia) | 4 | H | √ | √ | |
| 93 | 4 Cont. (Afro-Eurasia) | 4 | N | √ | √ | |
| 94 | 4 Cont. (Afro-Eurasia) | 4 | L | √ | √ | |
| 95 | Countries (Min.) | 173 | H | √ | √ | √ |
| 96 | Countries (w/o Lakes, Min.) | 173 | H | √ | √ | √ |
| 97 | Countries (Min., FFS) | 173 | H | √ | √ | √ |
| 98 | Countries (Min., DFS) | 173 | H | √ | √ | √ |
| 99 | Countries (Min., ISO 3166) | 173 | H | √ | √ | √ |
| 100 | Countries (Min.) | 173 | H | √ | √ | |
| 101 | Countries (w/o Lakes, Min.) | 173 | H | √ | √ | |
| 102 | Countries (w/o Ant. & SI) | 208 | H | √ | √ | √ |
| 103 | Countries (w/o Ant. & SI) | 170 | N | √ | √ | √ |
| 104 | Countries (w/o Ant.) | 163 | L | √ | √ | √ |
| 105 | Countries (w/o Ant., SI & Lakes) | 208 | H | √ | √ | √ |
| 106 | Countries (w/o Ant., SI & Lakes) | 170 | N | √ | √ | √ |
| 107 | Countries (w/o Ant. & Lakes) | 163 | L | √ | √ | √ |
| 108 | Countries (w/o Ant. & SI, FFS) | 208 | H | √ | √ | √ |
| 109 | Countries (w/o Ant. & SI, FFS) | 170 | N | √ | √ | √ |
| 110 | Countries (w/o Ant., FFS) | 163 | L | √ | √ | √ |
| 111 | Countries (w/o Ant. & SI, DFSs) | 208 | H | √ | √ | √ |
| 112 | Countries (w/o Ant. & SI, DFSs) | 170 | N | √ | √ | √ |
| 113 | Countries (w/o Ant., DFS) | 163 | L | √ | √ | √ |
| 114 | Countries (w/o Ant. & SI, ISO 3166) | 208 | H | √ | √ | √ |
| 115 | Countries (w/o Ant. & SI, ISO 3166) | 170 | N | √ | √ | √ |
| 116 | Countries (w/o Ant., ISO 3166) | 163 | L | √ | √ | √ |
| 117 | Countries (w/o Ant. & SI) | 208 | H | √ | √ | |
| 118 | Countries (w/o Ant. & SI) | 170 | N | √ | √ | |
| 119 | Countries (w/o Ant.) | 163 | L | √ | √ | |
| 120 | Countries (w/o Ant., SI & Lakes) | 208 | H | √ | √ | |
| 121 | Countries (w/o Ant., SI & Lakes) | 170 | N | √ | √ | |
| 122 | Countries (w/o Ant. & Lakes) | 163 | L | √ | √ | |
| 123 | Countries | 250 | H | √ | √ | √ |
| 124 | Countries | 194 | N | √ | √ | √ |
| 125 | Countries | 164 | L | √ | √ | √ |
| 126 | Countries (w/o Lakes) | 250 | H | √ | √ | √ |
| 127 | Countries (w/o Lakes) | 194 | N | √ | √ | √ |
| 128 | Countries (w/o Lakes) | 164 | L | √ | √ | √ |
| 129 | Countries (FFS) | 250 | H | √ | √ | √ |
| 130 | Countries (FFS) | 194 | N | √ | √ | √ |
| 131 | Countries (FFS) | 164 | L | √ | √ | √ |
| 132 | Countries (DFS) | 250 | H | √ | √ | √ |
| 133 | Countries (DFS) | 194 | N | √ | √ | √ |
| 134 | Countries (DFS) | 164 | L | √ | √ | √ |
| 135 | Countries (ISO 3166) | 250 | H | √ | √ | √ |
| 136 | Countries (ISO 3166) | 194 | N | √ | √ | √ |
| 137 | Countries (ISO 3166) | 164 | L | √ | √ | √ |
| 138 | Countries | 250 | H | √ | √ | |
| 139 | Countries | 194 | N | √ | √ | |
| 140 | Countries | 164 | L | √ | √ | |
| 141 | Countries (w/o Lakes) | 250 | H | √ | √ | |
| 142 | Countries (w/o Lakes) | 194 | N | √ | √ | |
| 143 | Countries (w/o Lakes) | 164 | L | √ | √ | |
| 144 | Rivers (Sng.Obj., OC) | 1 | H | √ | √ | √ |
| 145 | Rivers (Sng.Obj., OC) | 1 | N | √ | √ | √ |
| 146 | Rivers (Sng.Obj., OC) | 1 | L | √ | √ | √ |
| 147 | Rivers (Sep., OC) | 226 | H | √ | √ | √ |
| 148 | Rivers (Sep., OC) | 226 | N | √ | √ | √ |
| 149 | Rivers (Sep., OC) | 226 | L | √ | √ | √ |
| 150 | Rivers (Sng.Obj., CC) | 1 | H | √ | ||
| 151 | Rivers (Sng.Obj., CC) | 1 | N | √ | ||
| 152 | Rivers (Sng.Obj., CC) | 1 | L | √ | ||
| 153 | Rivers (Sep., CC) | 226 | H | √ | ||
| 154 | Rivers (Sep., CC) | 226 | N | √ | ||
| 155 | Rivers (Sep., CC) | 226 | L | √ | ||
| 156 | Rivers (FFS) | 226 | HNL | √ | √ | √ |
| 157 | Rivers (DFS) | 226 | HNL | √ | √ | √ |
| 158 | Rivers (FFS, Adp.) | 226 | HNL | √ | ||
| 159 | Lakes (Sng.Obj., Max.) | 1 | H | √ | √ | |
| 160 | Lakes (Sng.Obj.) | 1 | H | √ | √ | √ |
| 161 | Lakes (Sng.Obj.) | 1 | N | √ | √ | √ |
| 162 | Lakes (Sng.Obj.) | 1 | L | √ | √ | √ |
| 163 | Lakes (Sep., Max.) | 117 | H | √ | √ | |
| 164 | Lakes (Sep.) | 35 | H | √ | √ | √ |
| 165 | Lakes (Sep.) | 17 | N | √ | √ | √ |
| 166 | Lakes (Sep.) | 17 | L | √ | √ | √ |
| 167 | Lakes (FFS, Max.) | 117 | H | √ | √ | |
| 168 | Lakes (FFS) | 35 | H | √ | √ | √ |
| 169 | Lakes (FFS) | 17 | NL | √ | √ | √ |
| 170 | Lakes (FFS, Max., Adp.) | 117 | H | √ | ||
| 171 | Lakes (FFS, Adp.) | 35 | H | √ | ||
| 172 | Lakes (FFS, Adp.) | 17 | NL | √ | ||
| 173 | Lakes (Sep., Max.) | 117 | H | √ | √ | |
| 174 | Lakes (Sep.) | 35 | H | √ | √ | |
| 175 | Lakes (Sep.) | 17 | N | √ | √ | |
| 176 | Lakes (Sep.) | 17 | L | √ | √ | |
| 177 | Rail Network | 2 | H | √ | √ | √ |
| 178 | Rail Network | 2 | N | √ | √ | √ |
| 179 | Rail Network | 2 | L | √ | √ | √ |
| 180 | Roads (Sng.Obj., OC) | 1 | H | √ | √ | √ |
| 181 | Roads (Sng.Obj., OC) | 1 | N | √ | √ | √ |
| 182 | Roads (Sng.Obj., OC) | 1 | L | √ | √ | √ |
| 183 | Roads (Sep., OC) | 1860 | H | √ | √ | √ |
| 184 | Roads (Sep., OC) | 1860 | N | √ | √ | √ |
| 185 | Roads (Sep., OC) | 1860 | L | √ | √ | √ |
| 186 | Roads (Sng.Obj., CC) | 1 | H | √ | ||
| 187 | Roads (Sng.Obj., CC) | 1 | N | √ | ||
| 188 | Roads (Sng.Obj., CC) | 1 | L | √ | ||
| 189 | Roads (Sep., CC) | 1860 | H | √ | ||
| 190 | Roads (Sep., CC) | 1860 | N | √ | ||
| 191 | Roads (Sep., CC) | 1860 | L | √ | ||
| 192 | Capitals | 165 | HN | √ | √ | √ |
| 193 | Capitals | 157 | L | √ | √ | √ |
| 194 | Capitals (FFS) | 165 | HN | √ | √ | √ |
| 195 | Capitals (FFS) | 157 | L | √ | √ | √ |
| 196 | Capitals (FFS, Adp.) | 165 | HN | √ | ||
| 197 | Capitals (FFS, Adp.) | 157 | L | √ | ||
| 198 | Capitals (FFS) | 165 | HN | √ | √ | |
| 199 | Capitals (FFS) | 157 | L | √ | √ |
Object names
Almost all objects in The Best World Map for PowerPoint have names.
Names are assigned to all objects in all layers except for road layers.
All objects in each layer are ranked alphabetically according to their names. Only in some layers with embedded text in objects, the first 11-13 objects are not ranked alphabetically (so that objects with embedded text do not overlap each other’s names). In the “Capitals” layer, objects are arranged not alphabetically by the names of the capitals, but alphabetically by the names of countries and territories, since people tend to remember the names of countries better than their capitals.
In many cases, the name of the object contains additional information. For example, the full official country name and ISO code.
This hierarchy of objects will allow you to find the object you need very quickly.
Select the layer (group) or object whose name you want to change. To do this, click on it. Then click a second time on the selected layer (group) or object – now you can edit its name.
Thus, you can edit the name of any layer (group) or object except for the name of a group included in another group. To edit the name of such a group, you must first ungroup the group it belongs to.
Main layers
Each set of Best World Map for PowerPoint slides must have one or more Main Layers.
The Main Layer is one of the options for representing land.
In total, the Best World Map for PowerPoint can have 15 Main Layers:

")
")
")

")
")
")
")
")
")

")
")
")
Built-in Backgrounds
Each version of The Best World Map for PowerPoint has vector backgrounds. At the moment, only the Basic version is presented which contains 68 vector backgrounds.
The backgrounds are located in the Slide Master level as its layouts.
All backgrounds consist of one or more vector objects. Most of them can be completely edited – you can edit all the properties and shape of objects. In some cases, it is difficult to edit the shape of objects using PowerPoint tools.
1. Right-click on the thumbnail of the slide whose background you want to change
2. Select “Layouts” from the appeared context menu – now you can choose any of the built-in backgrounds.
1. Go to Slide Master (on the ribbon, View tab: View/Slide Master).
2. Before the “BG_44_Object” layout, all backgrounds have only a fill (flat or gradient). Except for the title layout, of course. Starting from the “BG_44_Object” object, all backgrounds contain at least one vector object.
3. If the background contains only a fill, then right-click on the background and select “Format Background” in the context menu that appears – now you can edit the background fill.
4. If the background contains vector object(s), then in addition to filling the background, you can edit all the properties of these objects and, in many cases, their shape. Note that some objects have PowerPoint effects applied.
5. Attention! If you want the color scheme replacement function to work correctly, then when changing the background colors, use only the colors from the palette of the current Color Scheme.
Here are only backgrounds containing vector objects.
![]()
![]()
![]()
![]()
![]()
![]()
![]()
![]()
![]()
![]()
![]()
![]()
![]()
![]()
![]()
![]()
![]()
![]()
![]()
![]()
![]()
![]()
![]()
![]()
![]()
![]()
![]()
![]()
![]()
![]()
![]()
![]()
![]()
![]()
![]()
![]()
![]()
![]()
![]()
![]()
![]()
![]()
![]()
![]()
![]()
![]()
![]()
![]()
![]()
![]()
![]()
![]()
![]()
![]()
![]()
![]()
![]()
![]()
![]()
![]()
![]()
![]()
![]()
![]()
![]()
![]()
![]()
![]()
Color Sets
There are six Color Sets for the Basic variant of The Best World Map for PowerPoint:
1. CS001 – Business & Consulting
2. CS002 – Business & Consulting
3. CS009 – Maps
4. CS010 – Maps
5. CS014 – Industrial & Natural
6. CS024 – Emotions & Moods
Each Color Set (Basic variant) contains seven color schemes:
CS001 – Business & Consulting
![]()
![]()
![]()
![]()
![]()
![]()
![]()
CS002 – Business & Consulting
![]()
![]()
![]()
![]()
![]()
![]()
![]()
CS009 – Maps
![]()
![]()
![]()
![]()
![]()
![]()
![]()
CS010 – Maps
![]()
![]()
![]()
![]()
![]()
![]()
![]()
CS014 – Industrial & Natural
![]()
![]()
![]()
![]()
![]()
![]()
![]()
CS024 – Emotions & Moods
![]()
![]()
![]()
![]()
![]()
![]()
![]()
Attention! A quick change to the Color Scheme in the entire presentation will only work if only the colors from the Color Scheme palette are applied to all the slides in the presentation and in all layouts of the template to all objects. If you use colors other than the Color Scheme palette, these colors will not change when you apply a different Color Scheme. Use this method if you don’t want the colors of some objects to change when applying the Color Scheme.
1. On the ribbon, select the “Design” tab
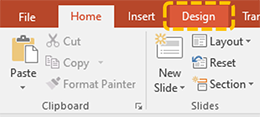
2. Go to the “Variants” area
3. Click on the dropdown button
4. In the drop-down list, move the cursor to “Colors”.
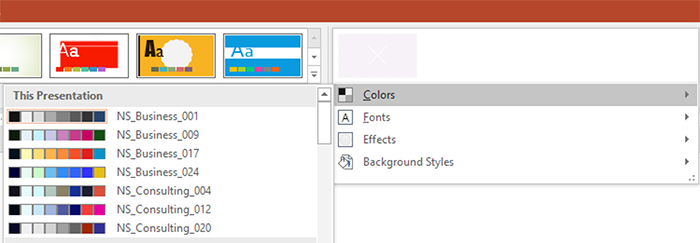
5a. If you need to change the colors in the entire presentation, then in the appeared list of Color Schemes in the “This presentation” section, select the Color Scheme by clicking the left mouse button.
5b. If you need to change the colors on one or several slides (they must be preselected), then in the appeared list of Color Schemes in the “This presentation” section, select a Color Scheme and right-click on its name. In the context menu that appears, select “Apply to Selected Slides”.
After downloading “The Best World Map for PowerPoint”, if you want to add Color Scheme or several additional Color Schemes, then you can choose them from our Color Scheme catalog.
You can also add additional Color Schemes to any of your presentations from our catalog of Color Schemes.
Also, if you would like to integrate Color Schemes from our catalog into your system, you can purchase the XML files of the Color Schemes here.
If you need to bring all the colors of your presentation by the Color Scheme palette, then you can order this service here.
Slide sizes
NeedSlide offers you a wide variety of slide sizes for «The Best World Map for PowerPoint» – 6 slide sizes.
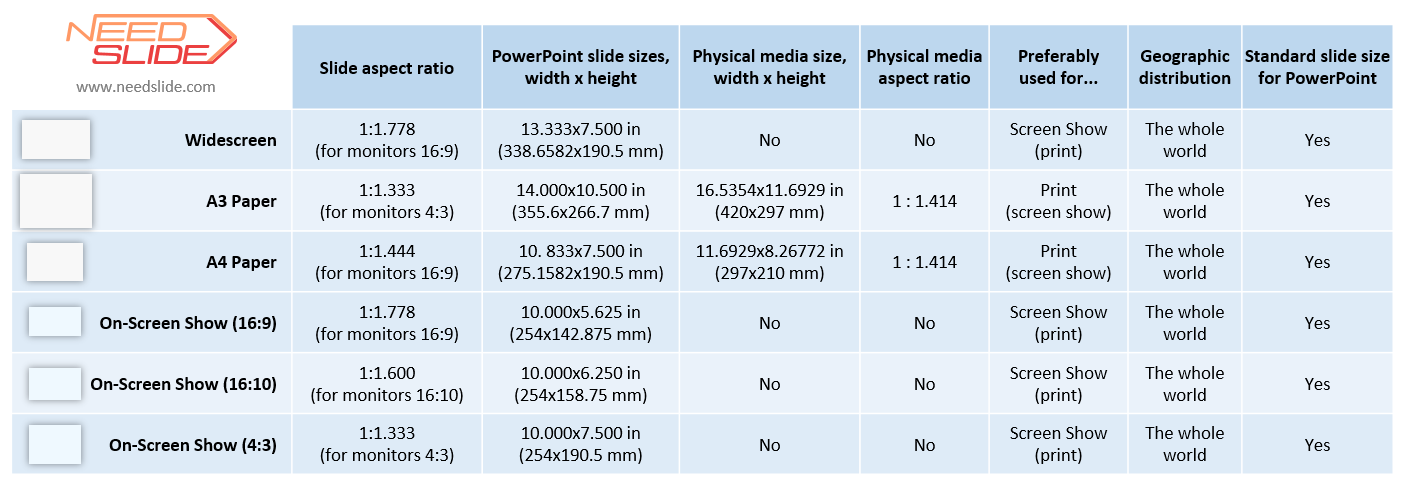
Please note that the slide size in PowerPoint is different from the physical media size. For example, the A3 Paper slide size in PowerPoint is 14.000×10.500 in (355.6×266.7 mm), and the physical A3 paper size is 16.5354×11.6929 in (420×297 mm) – part of the distance on the paper margins when printing.
Over time, we will increase the number of available slide sizes to 16 for “The Best World Map for PowerPoint”.
If you have not found a slide of a suitable size, then you can order us to transfer slides to one of 16 slide sizes from our catalog or order a slide of any other non-standard size.
How to choose the World Map on NeedSlide?

 180
180

 245
245

 401
401

 336
336

 63
63

 349
349
Reviews
There are no reviews yet.