


Principles that we are followed when creating a Cyclic Process Diagram
Any slide consists of a set of different objects – vector objects, raster objects, text boxes, tables, charts, etc. All standard PowerPoint shapes are vector. At the same time, text boxes are also vector objects. For example, you can assign a fill and an outline to a text box. A vector object can perform the functions of a text box if you insert text into it. Thus a vector object and a text box are, in fact, the same type of object.
NeedSlide only uses vector objects. This doesn’t mean you can’t use raster objects – with NeedSlide slides you can use raster objects (pictures, photos, etc.) without any restrictions. But initially, on the slides from NeedSlide, you will find only vector objects.
All objects must be vector
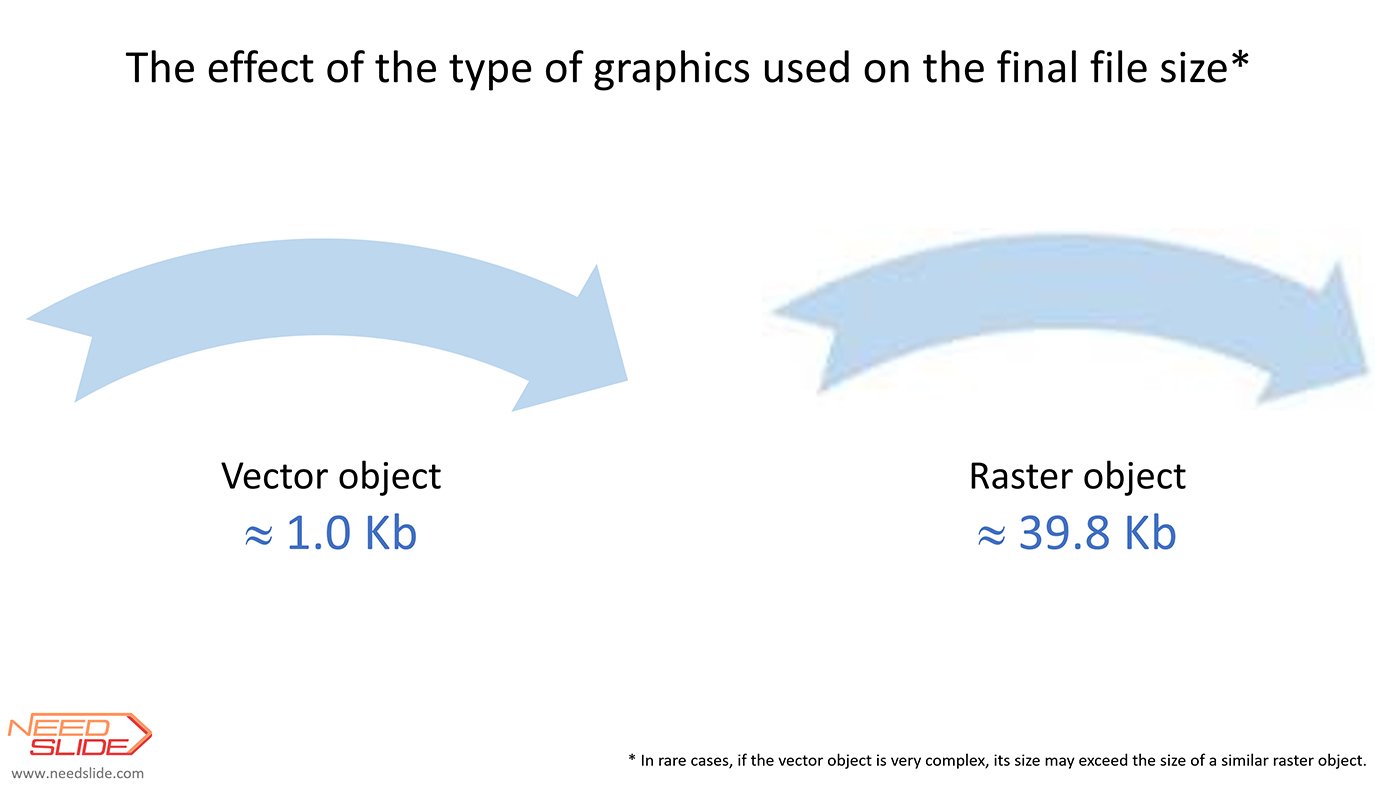
Vector objects allow you to have full control over the properties of an object – change the properties of the fill and outline and, in many cases, change the object’s shape. Also, vector objects make it possible to insert text inside the object, making the text an integral part of the object. In addition, vector objects can be scaled without loss of quality. Another advantage of vector objects is their small size and, accordingly, the ability to get smaller final file size. In rare cases, if there are a lot of very complex vector objects on the slide, the result may be the opposite – an increase in the final file size.

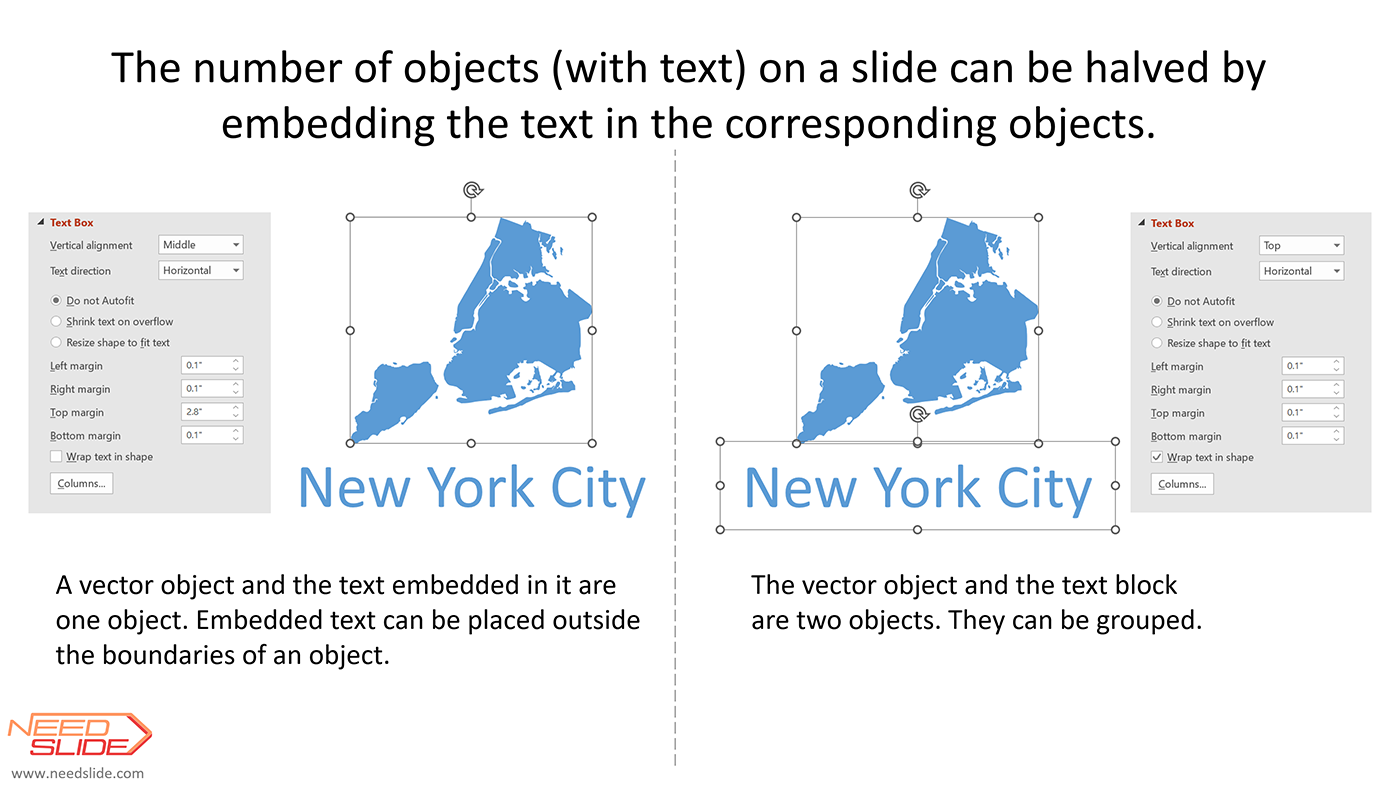
You can insert text into any vector object. This applies not only to standard PowerPoint shapes but also to any non-standard vector objects, including non-symmetrical objects. To do this, select the vector object and type the text – it will appear inside the vector object. If the vector object is not symmetrical or has a rather complex shape, then the text may appear in an unexpected place, including outside the boundaries of the object. In this case, to align the text relative to the vector object, use the object’s internal margin settings. How to do this is described below.

Unlike raster objects, vector objects can be scaled without loss of quality.

Each object must be optimized for use in PowerPoint
Optimization of vector objects for use in PowerPoint is the correction of nodes and the removal of unnecessary nodes, the correction of errors in curves (for example, the elimination of gaps in a curve), etc.
Unoptimized vector objects may behave unexpectedly in PowerPoint. They can also increase the size of the final file. Therefore, if possible, we optimize vector objects for use in PowerPoint.

All objects must be fully editable
Unlike raster objects, which can only be partially edited in PowerPoint, vector objects can be edited without restrictions (in rare cases, when the vector object is very complex, editing may not be available or limited). The principle of full editability of objects is closely related to the principle of using only vector objects.
If possible, each object should be the way the user sees
To make the user’s work with vector objects predictable, we try to make the shape of the objects exactly the way the user sees them. This is not always possible and not always advisable. But in most cases, the object has exactly the shape that the user sees.

If possible, the text should be embedded in the object
There are different opinions about whether or not to embed text in a vector object. According to our observations, novice users prefer to place text above the object, and advanced users prefer, if it is reasonable and possible, to embed the text in a vector object. In the first case, you can quickly visually align the text relative to the object (text and object can be grouped), but you have to manipulate two objects and the alignment may not be very accurate. If there are too many objects on a slide, then in some cases, this can slow down the program’s response to user actions. In the second case, embedded text alignment relative to the object may take a little longer and requires skills in working with margins inside the object (see below for how to work with margins). But in this case, the user works with one, not two objects. A significant disadvantage of this method is the need to edit text margins in a vector object each time the object is scaled. However, for experienced users, this is not a problem.
Where possible, individual objects and/or groups of objects should be interchangeable
For the convenience of our users and to ensure that they have a wide choice, we try to make our products as versatile as possible and the objects on the slides are interchangeable. For example, this means that within one product (one presentation file), you can change the central elements of the diagram – they are already aligned with the slide. The same applies to the steps of the cycle as a whole, and the additional call-out text too. They are also aligned with the slide. In addition, individual steps from different diagrams can be combined (for example, to use steps of different lengths in one diagram) – their position on the slide is also aligned with the slide. Moreover, you can replace objects and groups of objects from different products (presentation files) as long as their slide size and diagram shape match.


We create custom objects whenever possible
Any confident user can create a slide using standard PowerPoint shapes and standard PowerPoint tools. Therefore, we try to create slides that contain non-standard objects or objects whose creation may cause difficulties for the average user or not cause difficulties, but require a lot of time. One of the important functions of a slide (besides conveying important information and/or inciting action) is the ability to impress the audience and leave a mark in their memory of the audience. Non-standard, unusual slides can contribute to this. But we also remember that in many cases, slides are used for communication within companies and, often, are business in nature. Such slides should be characterized by simplicity and even asceticism. We try to go in the middle, and fulfill both requirements – the slide must be impressive and at the same time, businesslike, strict, and concise. Therefore, we pay great attention to design details and try to diversify it both in shape and color.

What is Cyclic Process Diagram?
General description
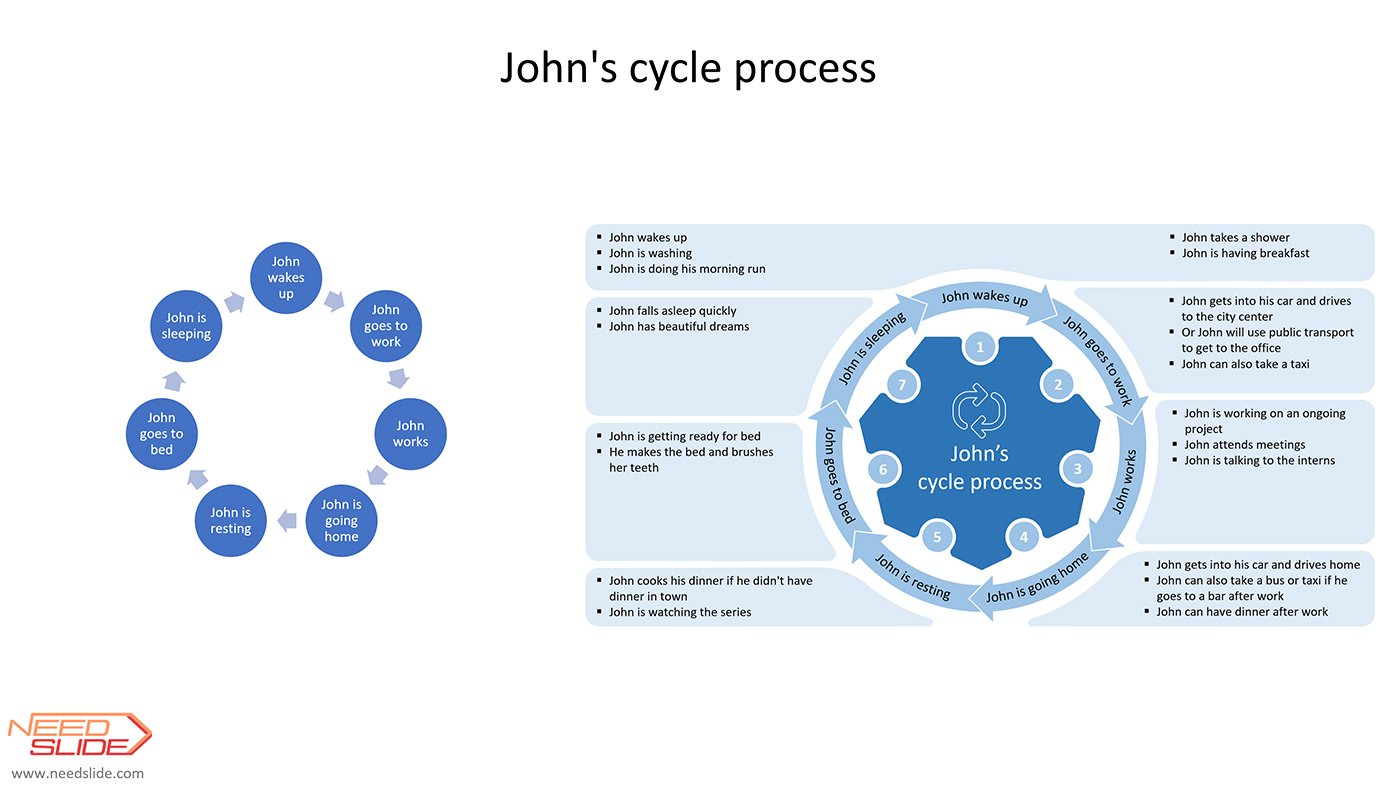
Let’s describe a simple example of a cyclic process. Everyone knows John. Well, if not all, then get acquainted: John lives in the suburbs and works as a designer at ArtFabProcessing, whose office is located in the down city. John enjoys his work and is respected by his colleagues. John runs in the morning, loves TV series, and is very proud of his stamp collection. Let’s describe John’s usual daily routine. John gets up in the morning and drives to work. John works until evening and returns home after work. John then rests and goes to bed. And the next day everything repeats. This is a cyclic process. On a slide, this cyclic process might look like this:

In this example, a variant with a standard diagram (SmartArt) and a variant of the Cyclic Process Diagram from NeedSlide are presented.
We can make the cyclic process more detailed:
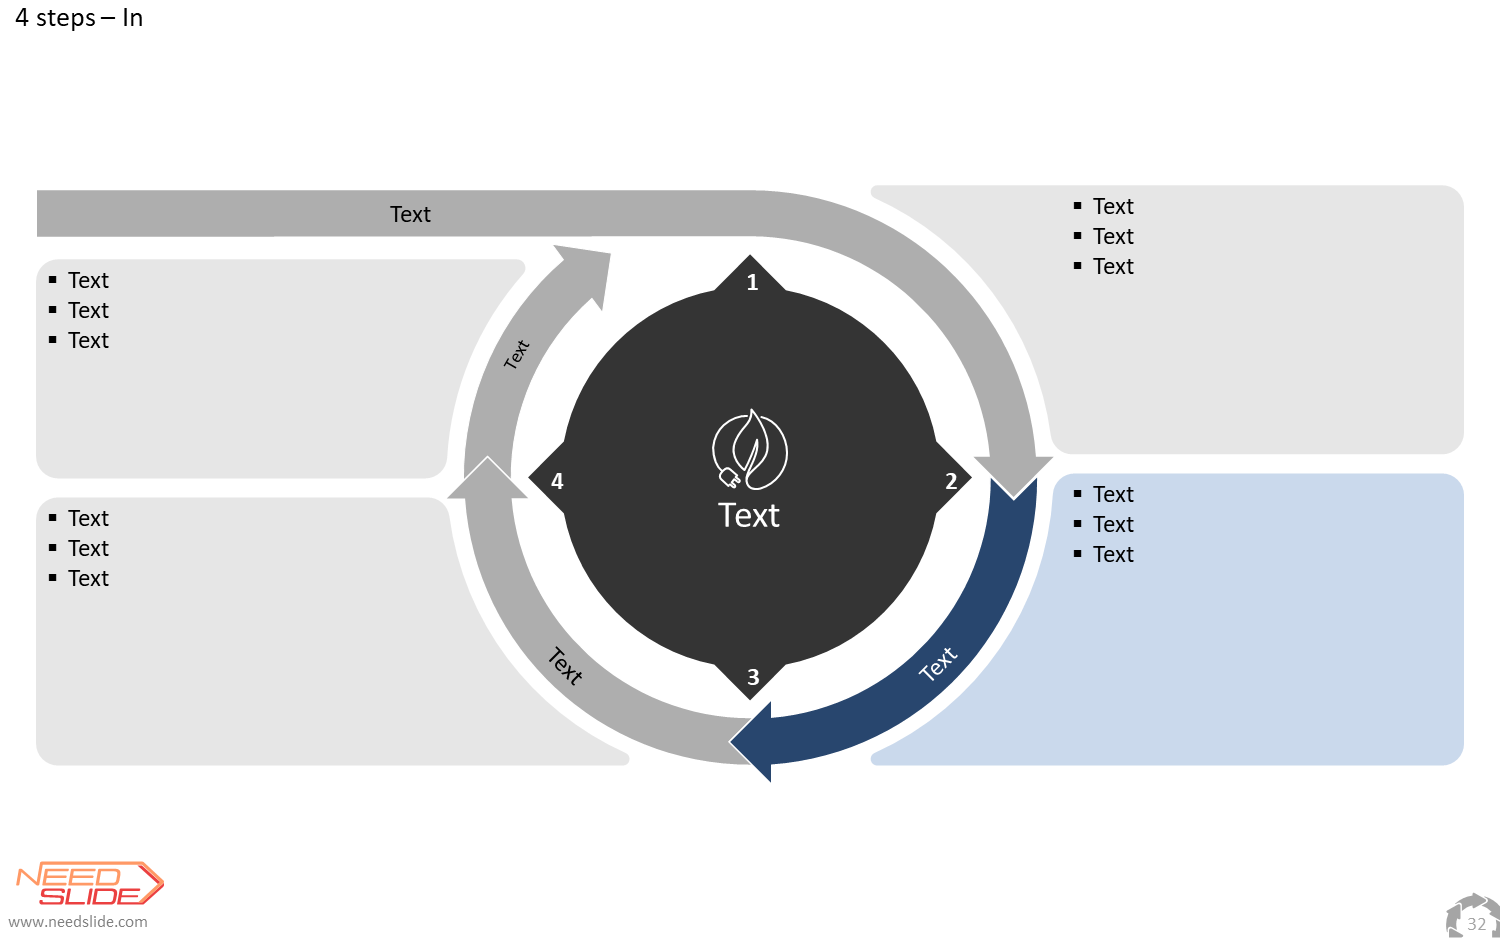
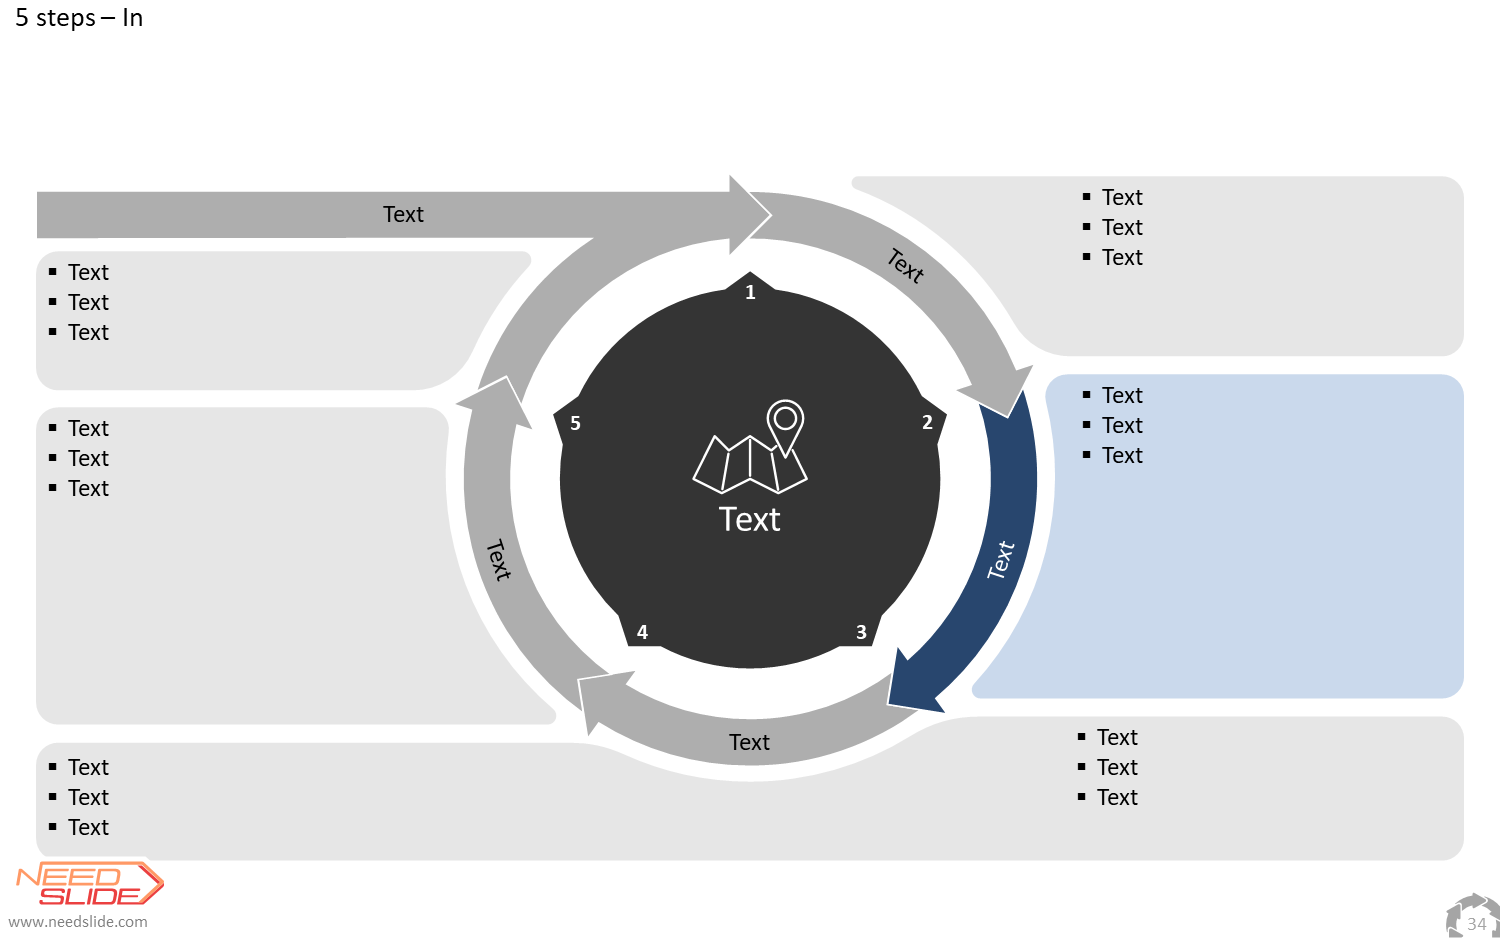
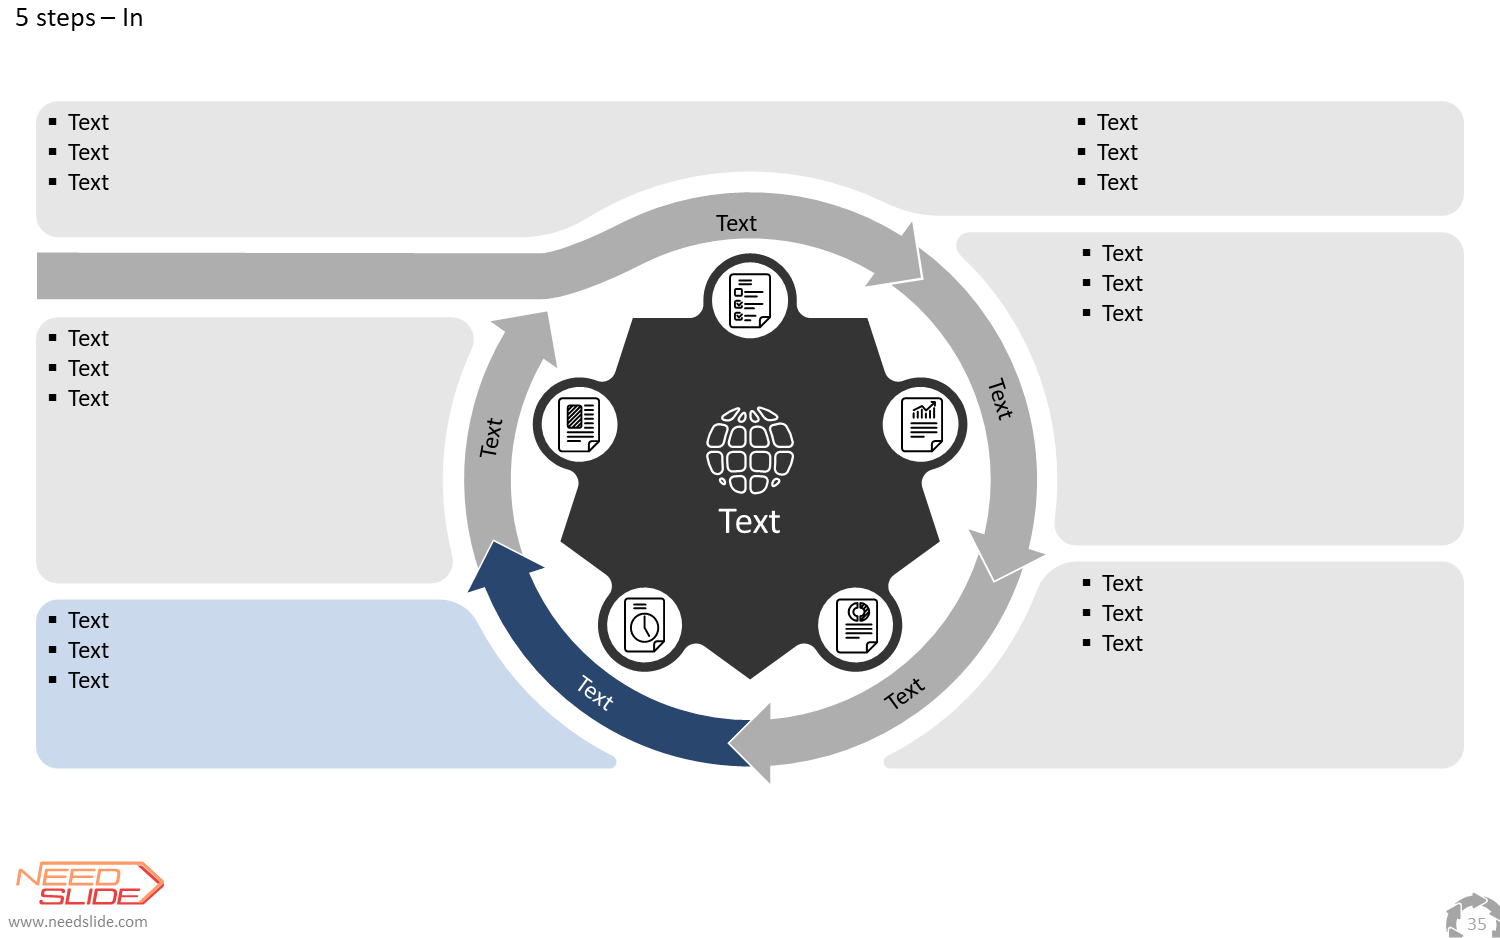
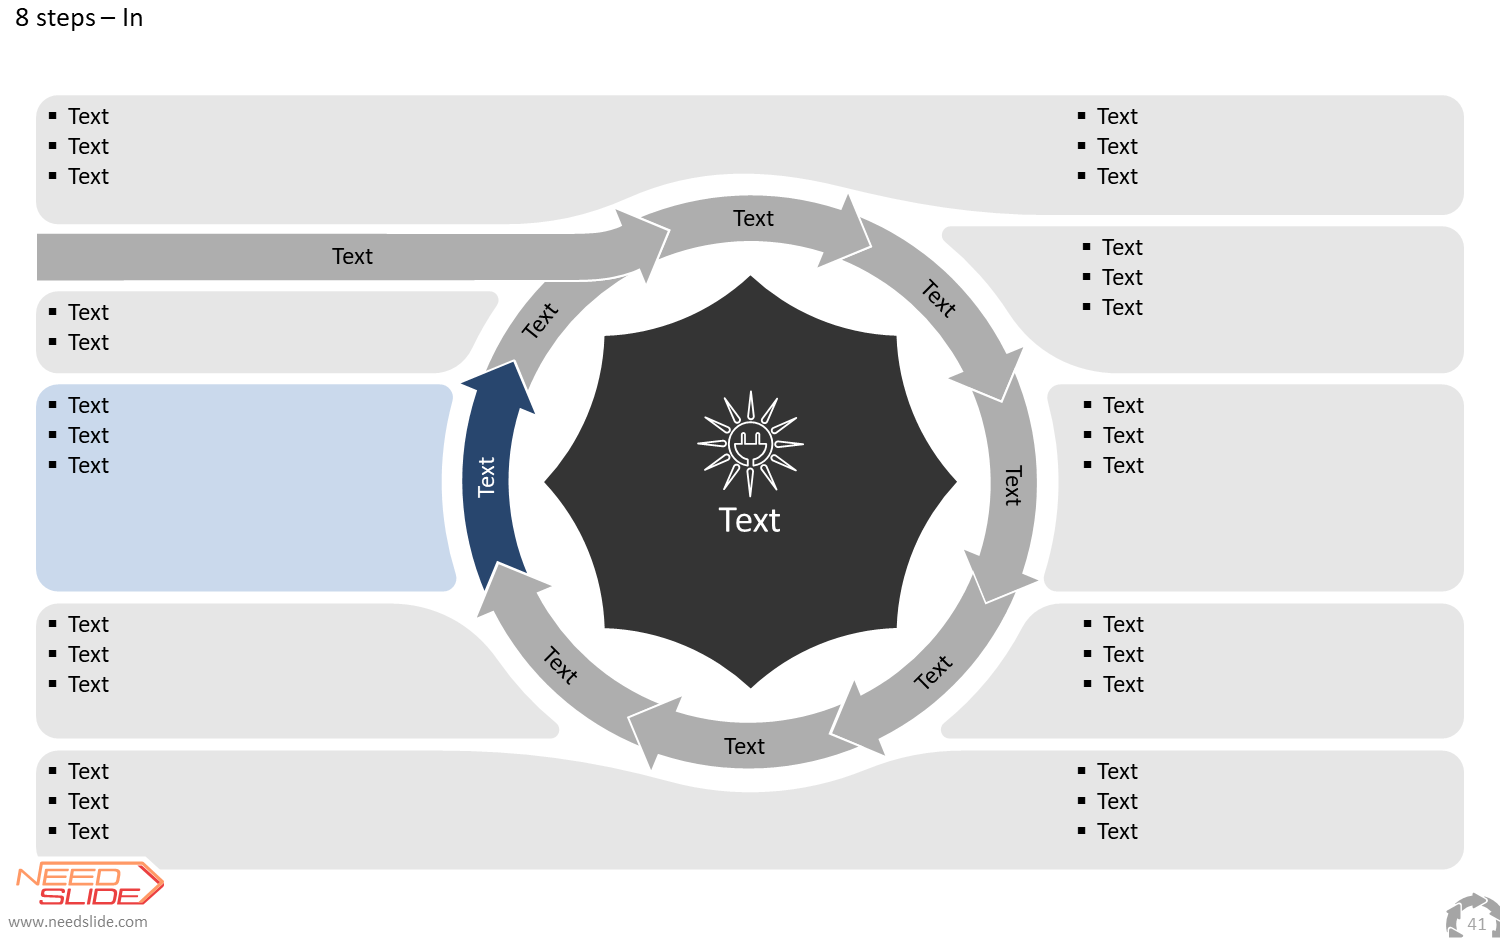
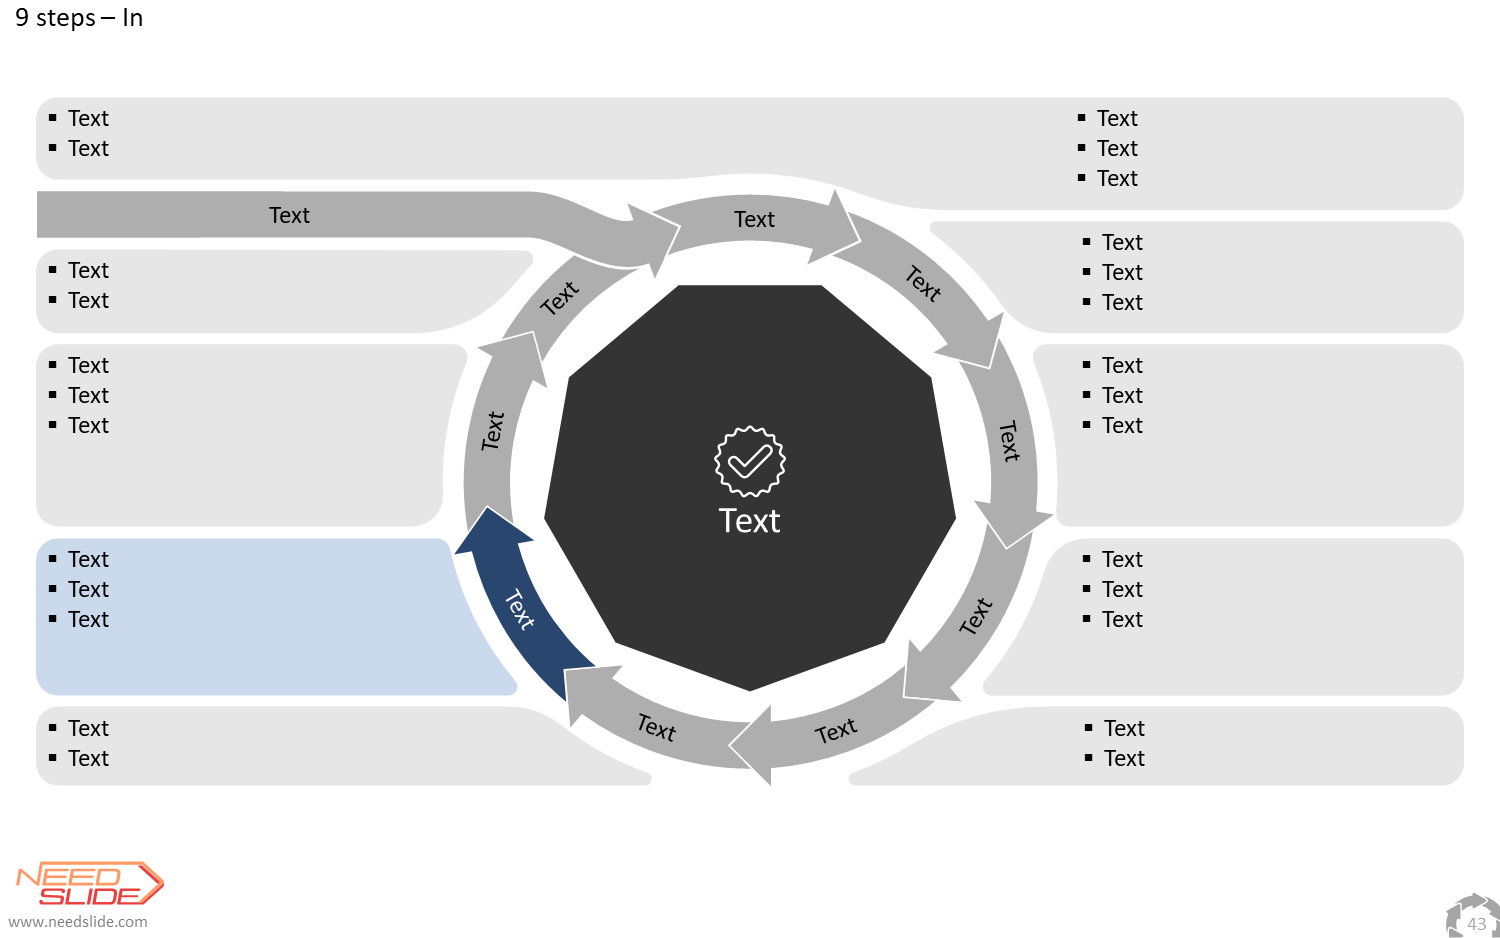
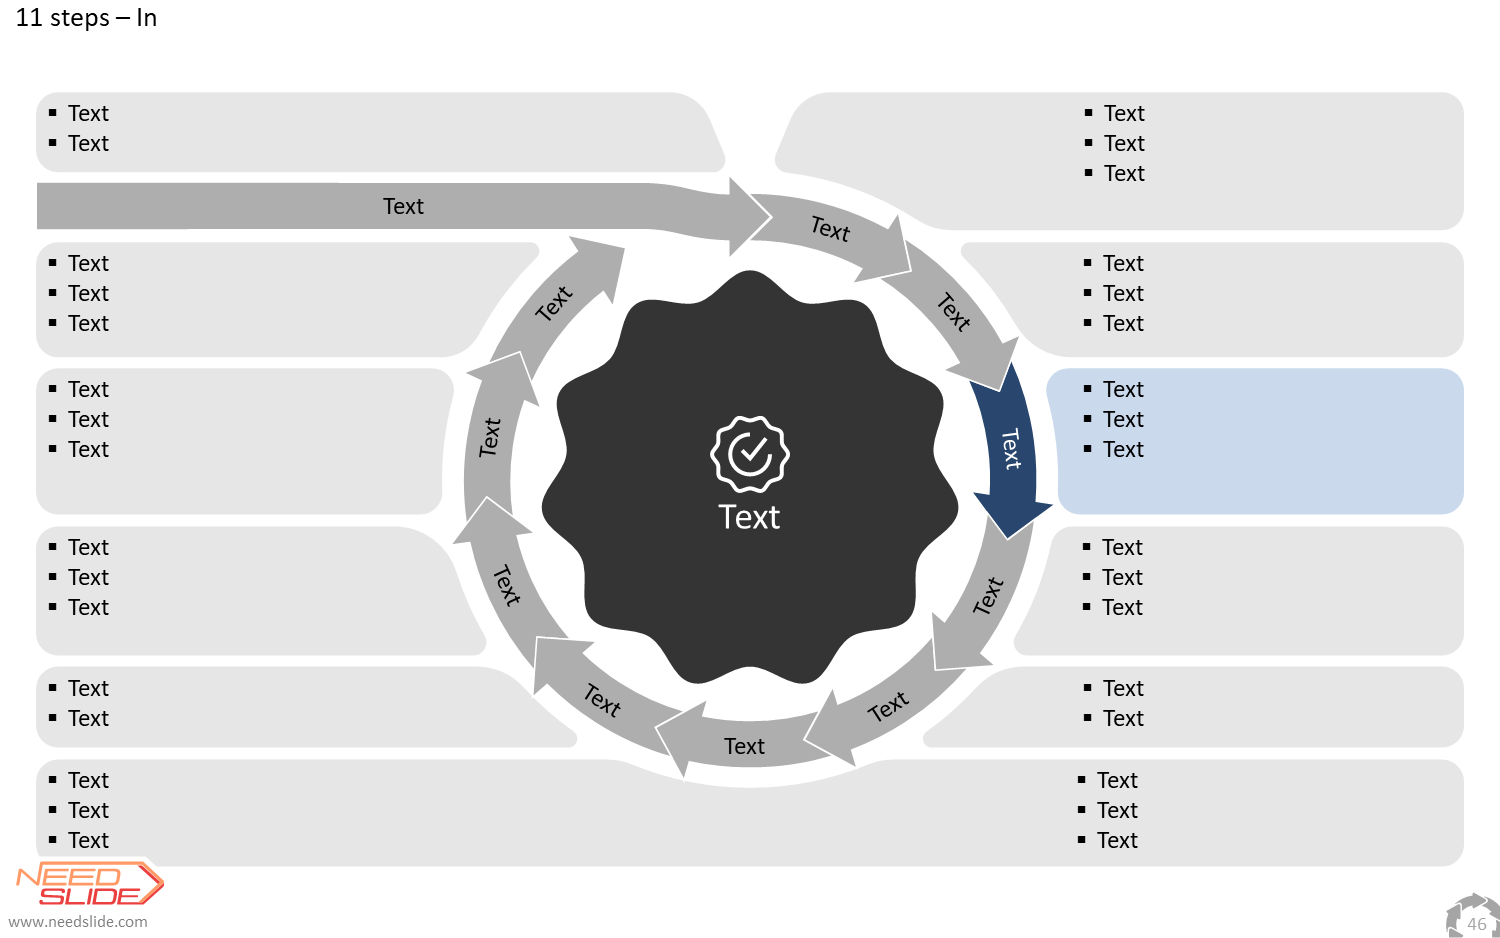
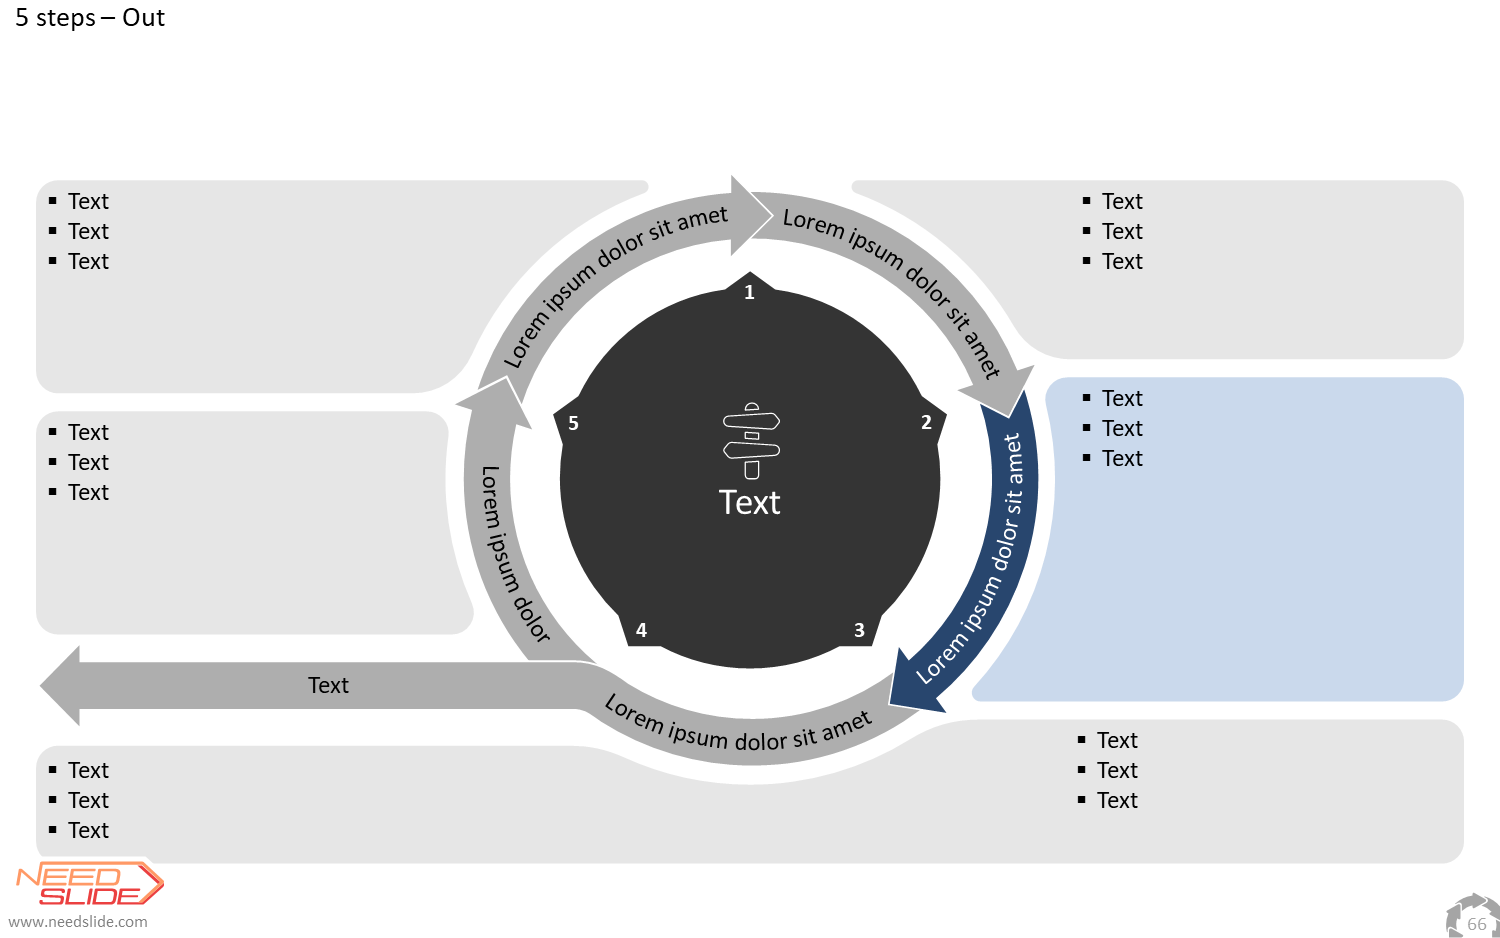
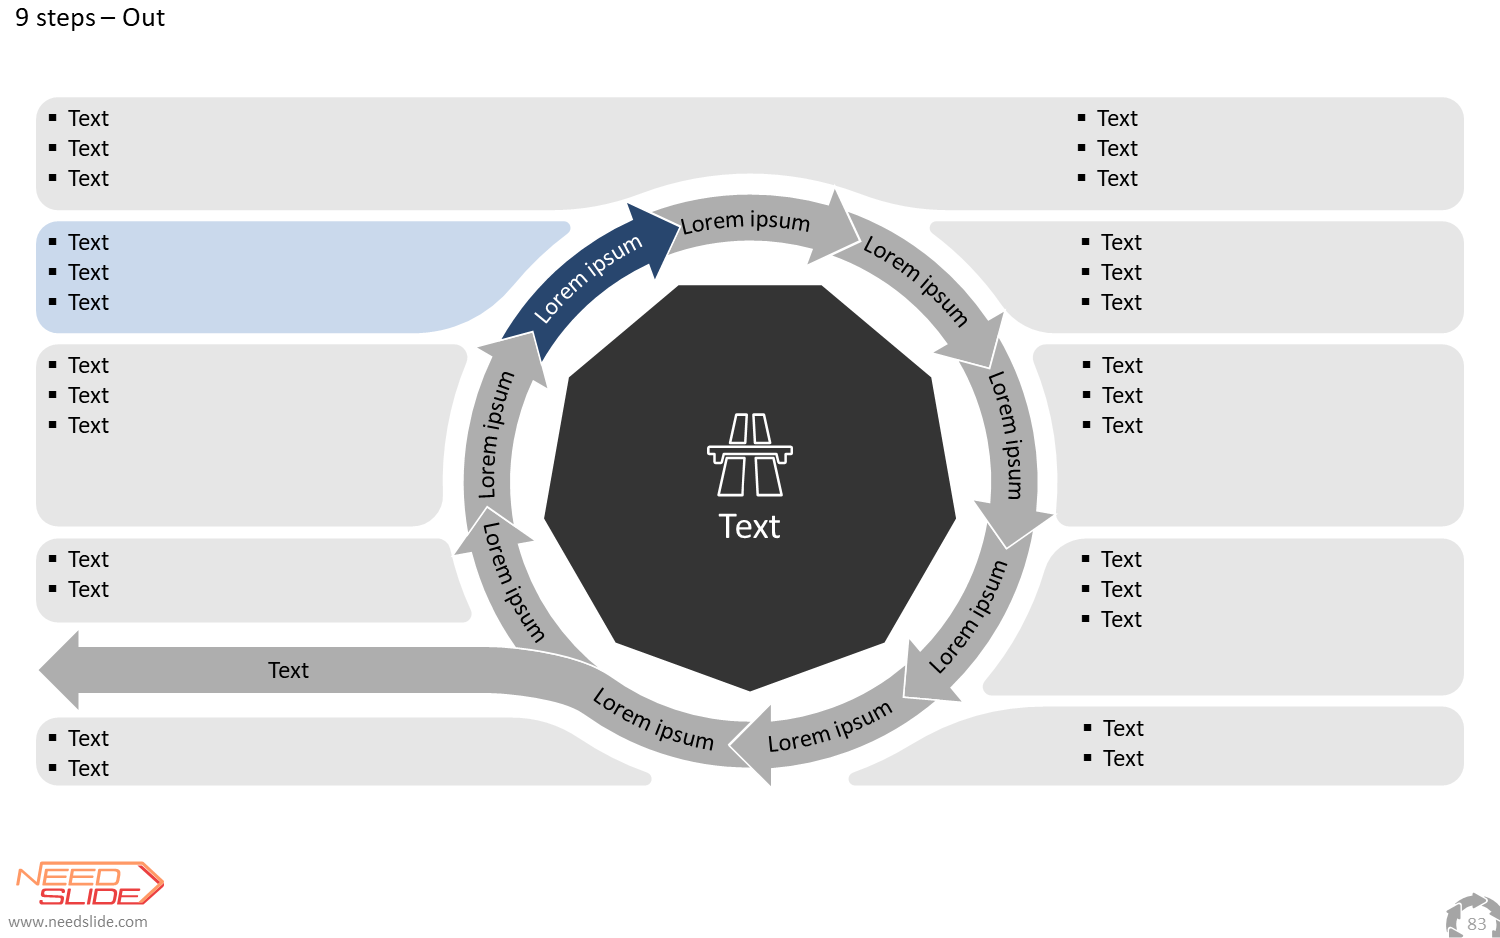
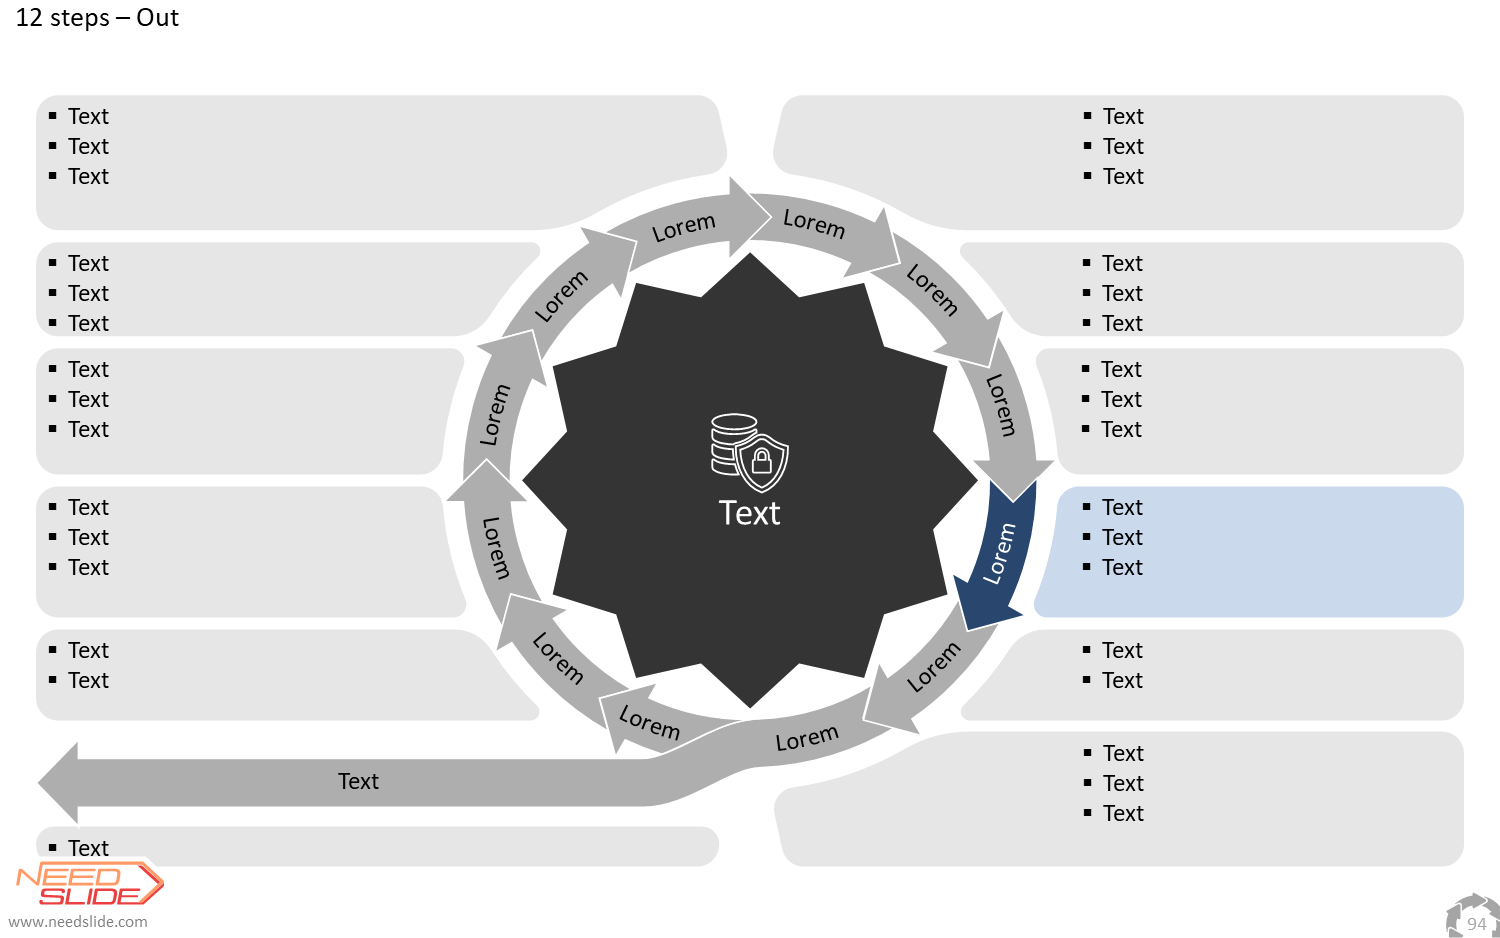
And even more detailed… For this, we need a diagram with more steps. Each NeedSlide Cyclic Process Diagram has many diagram options with a different number of steps:

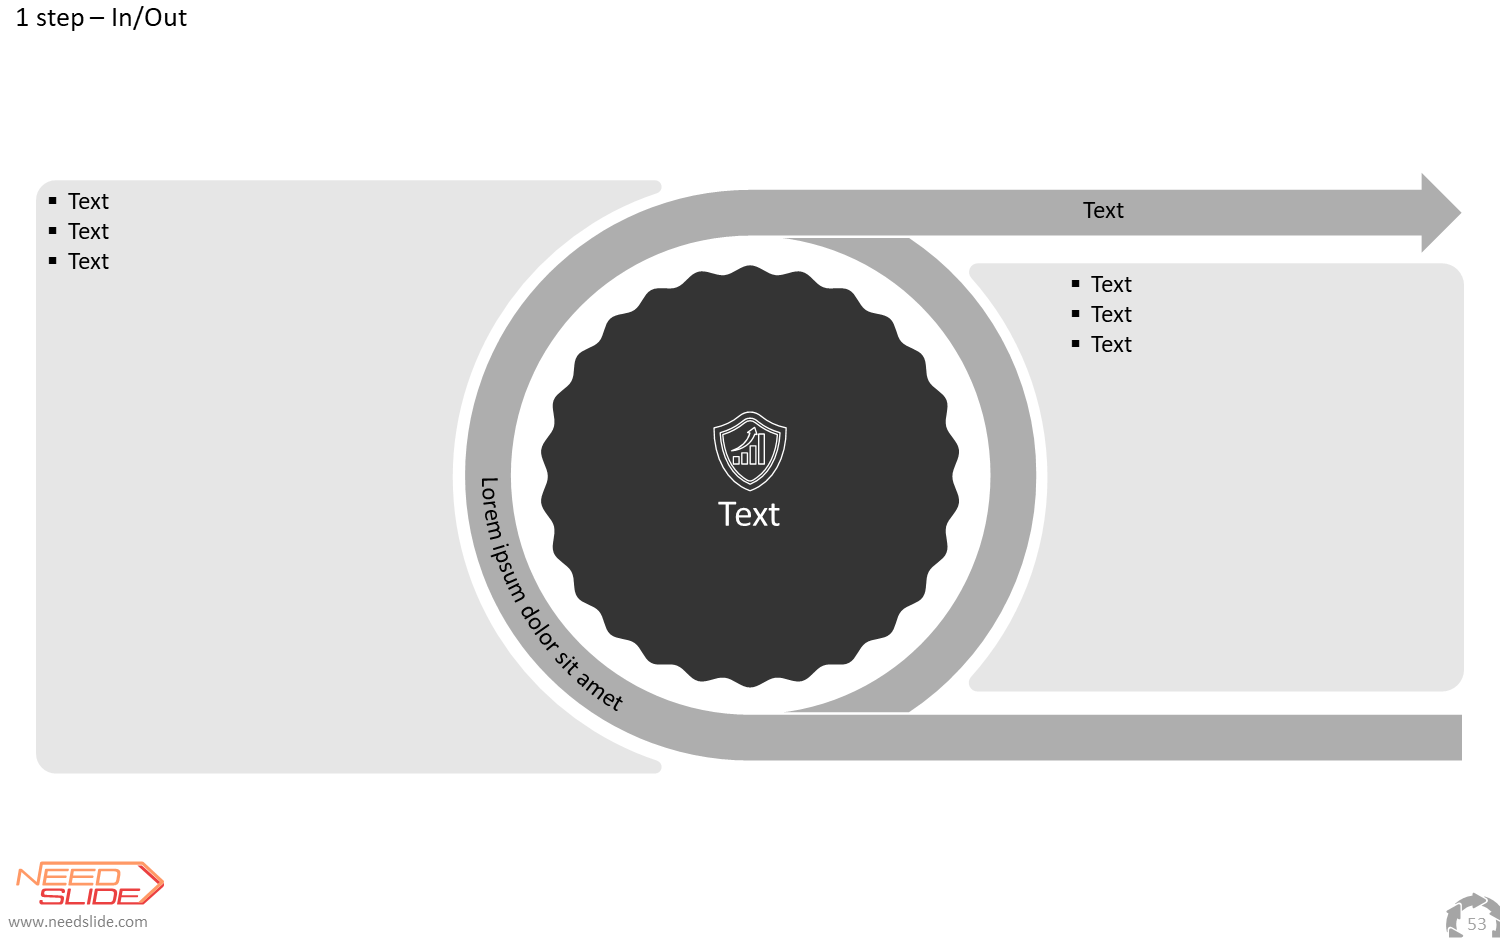
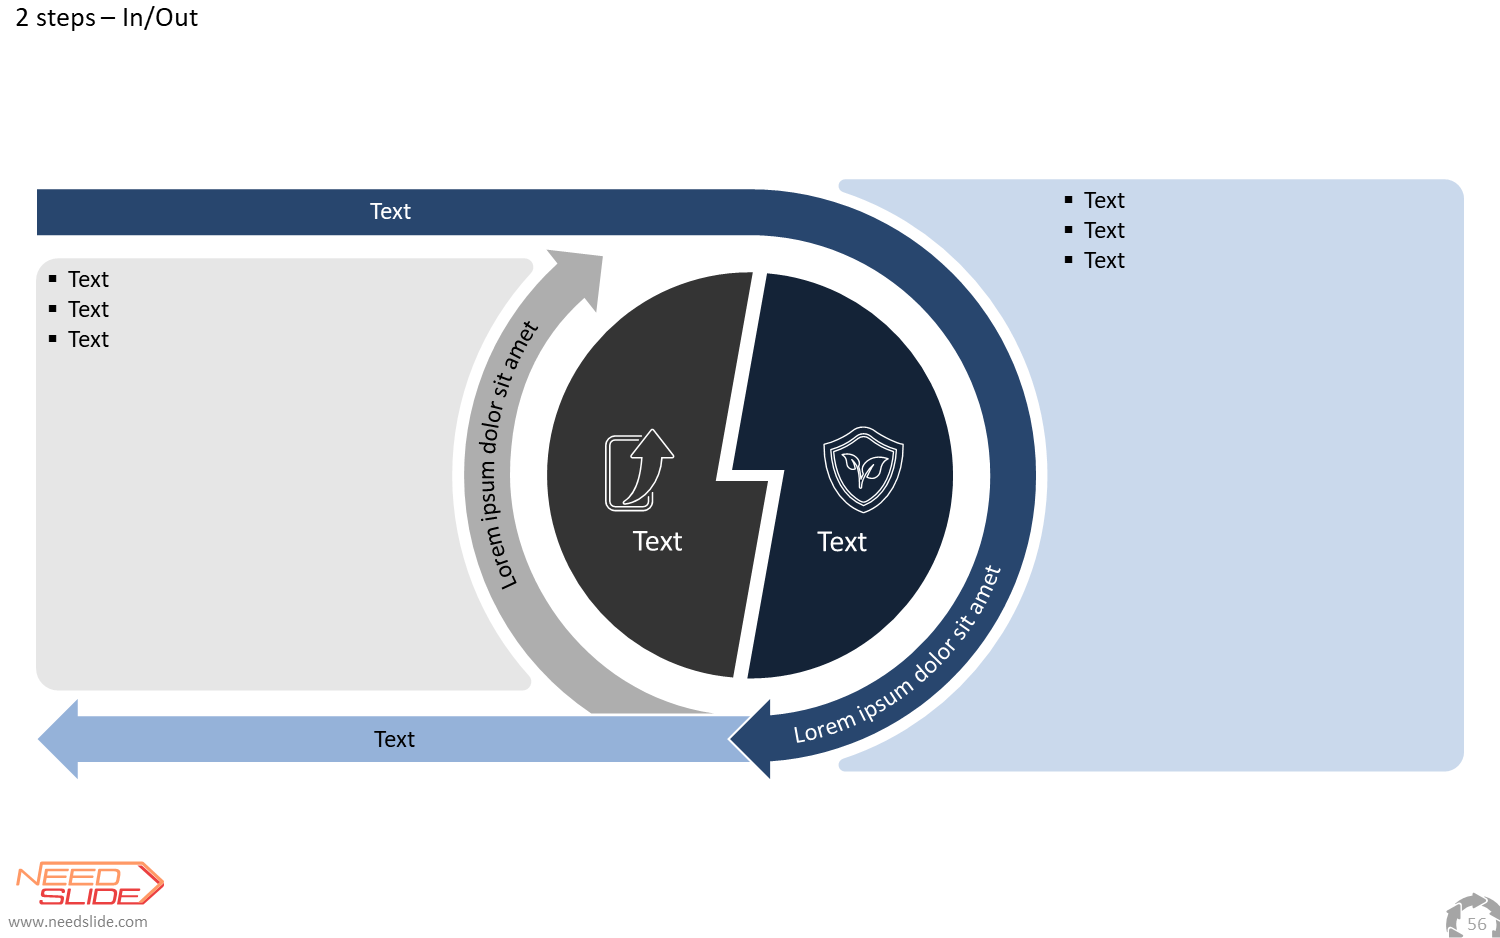
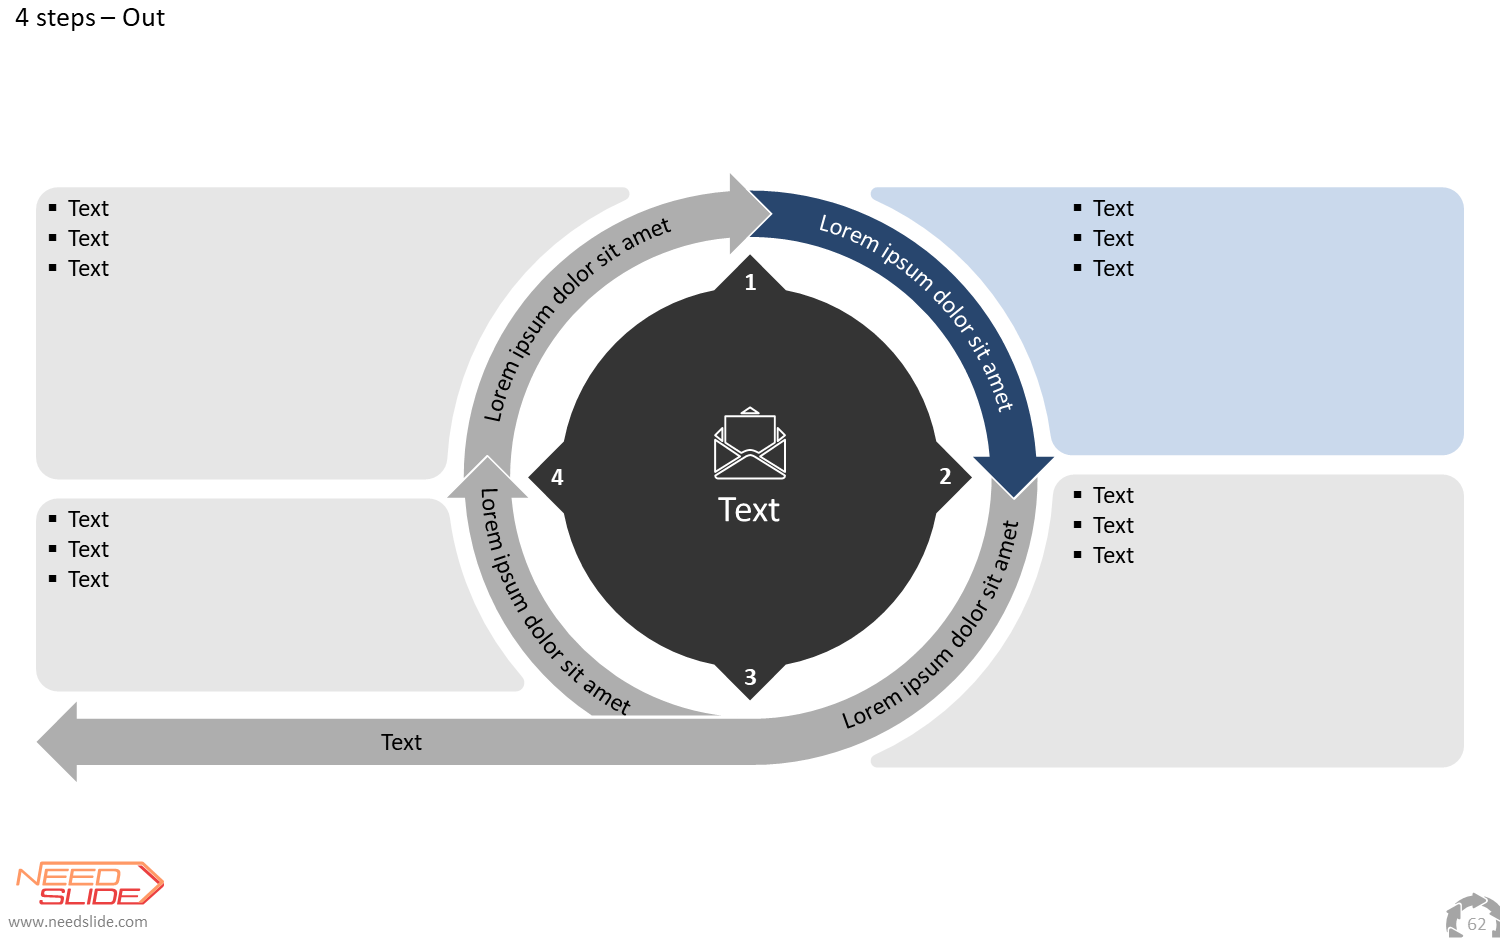
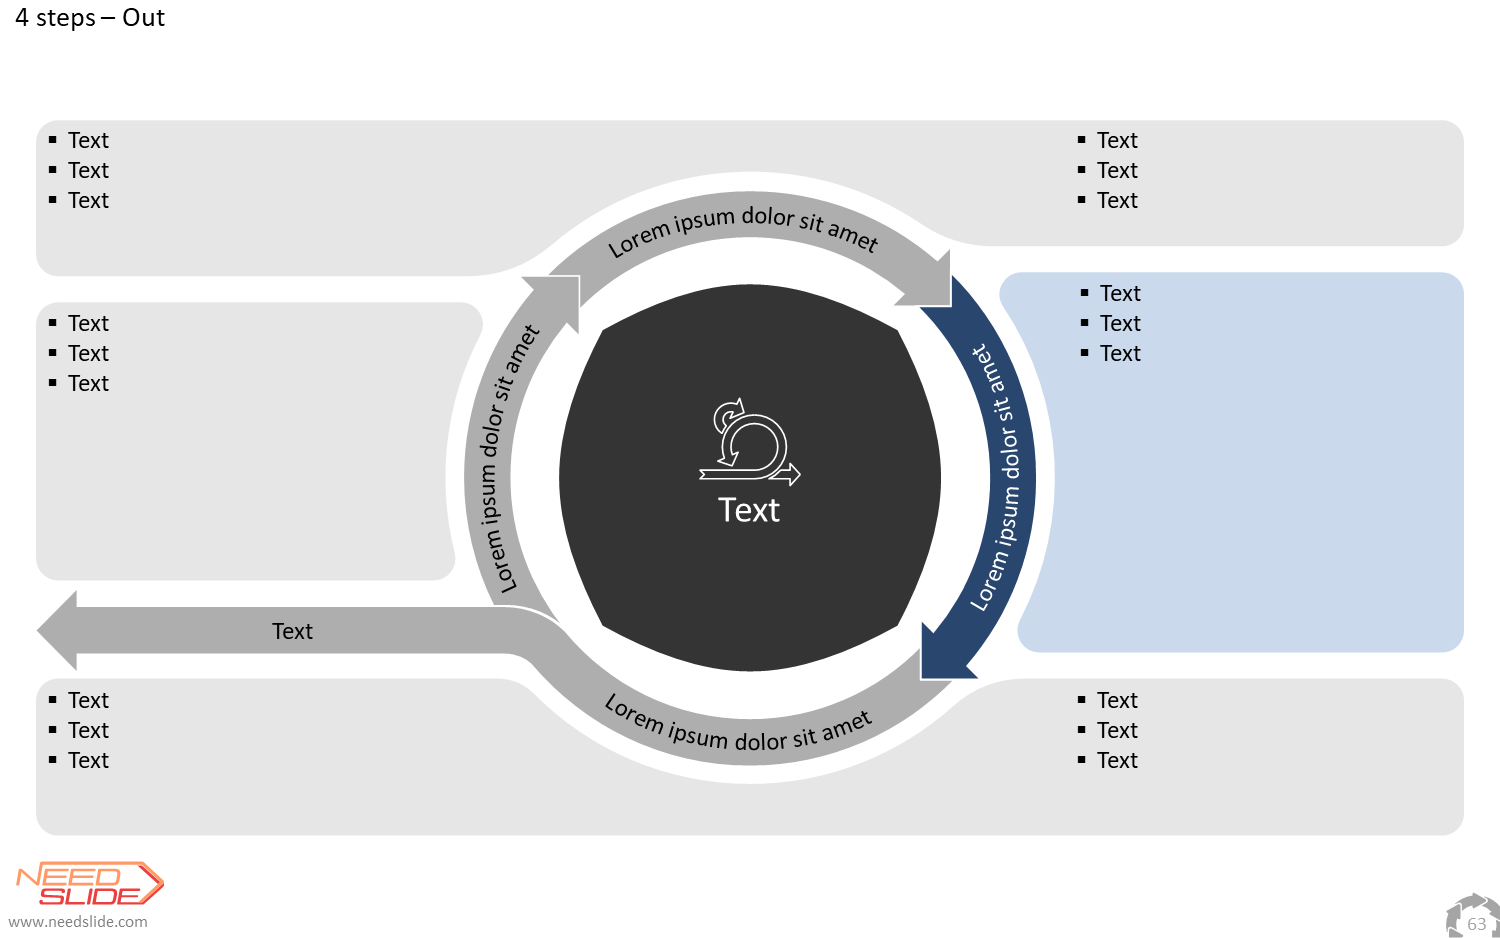
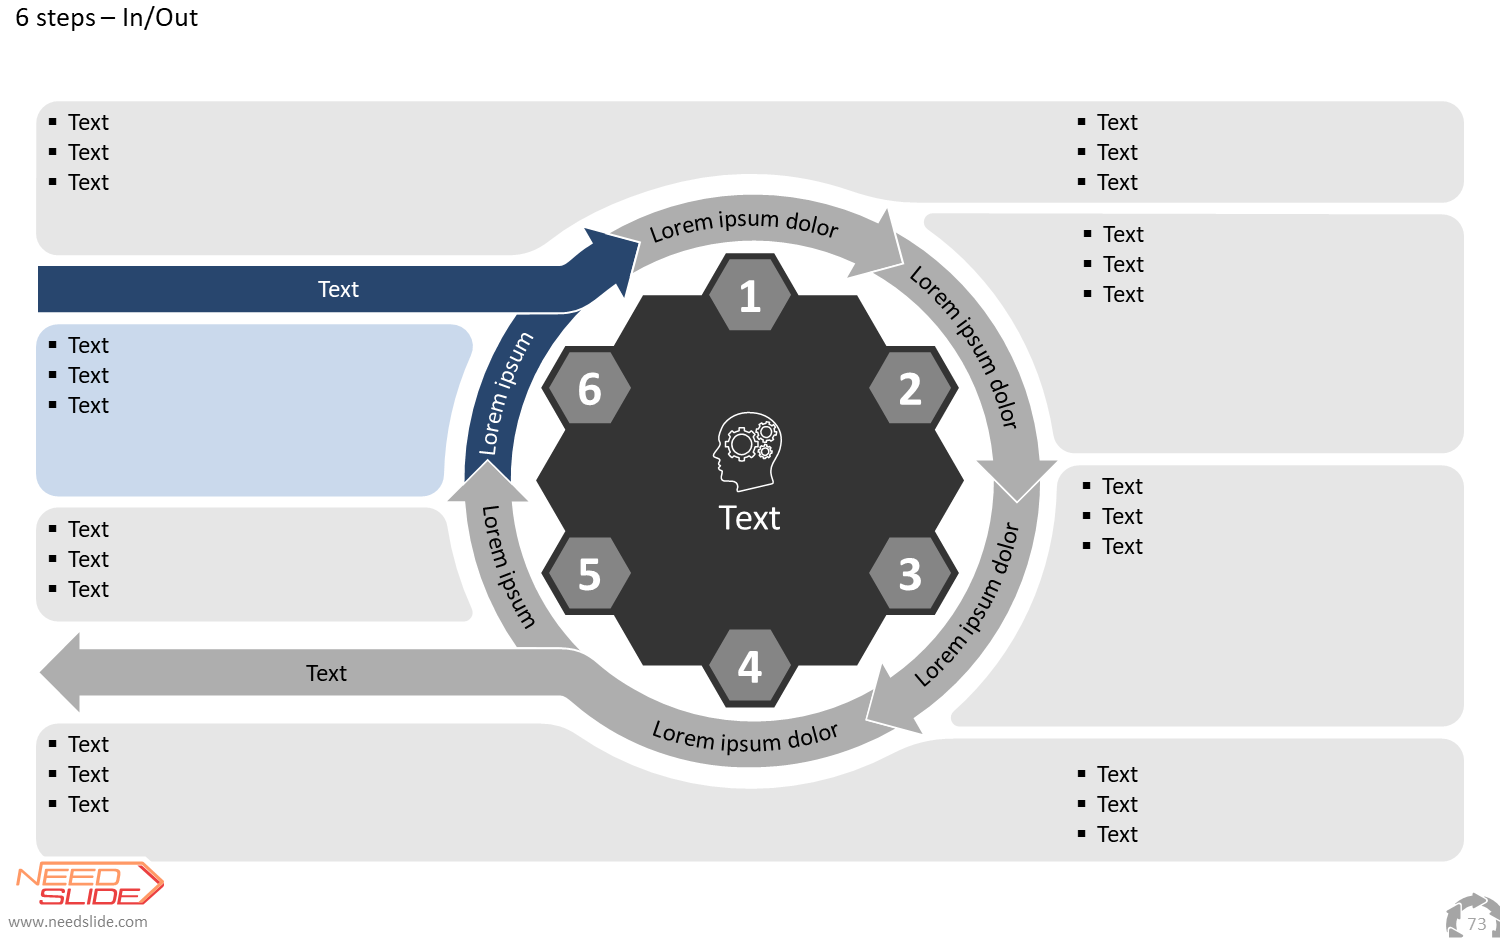
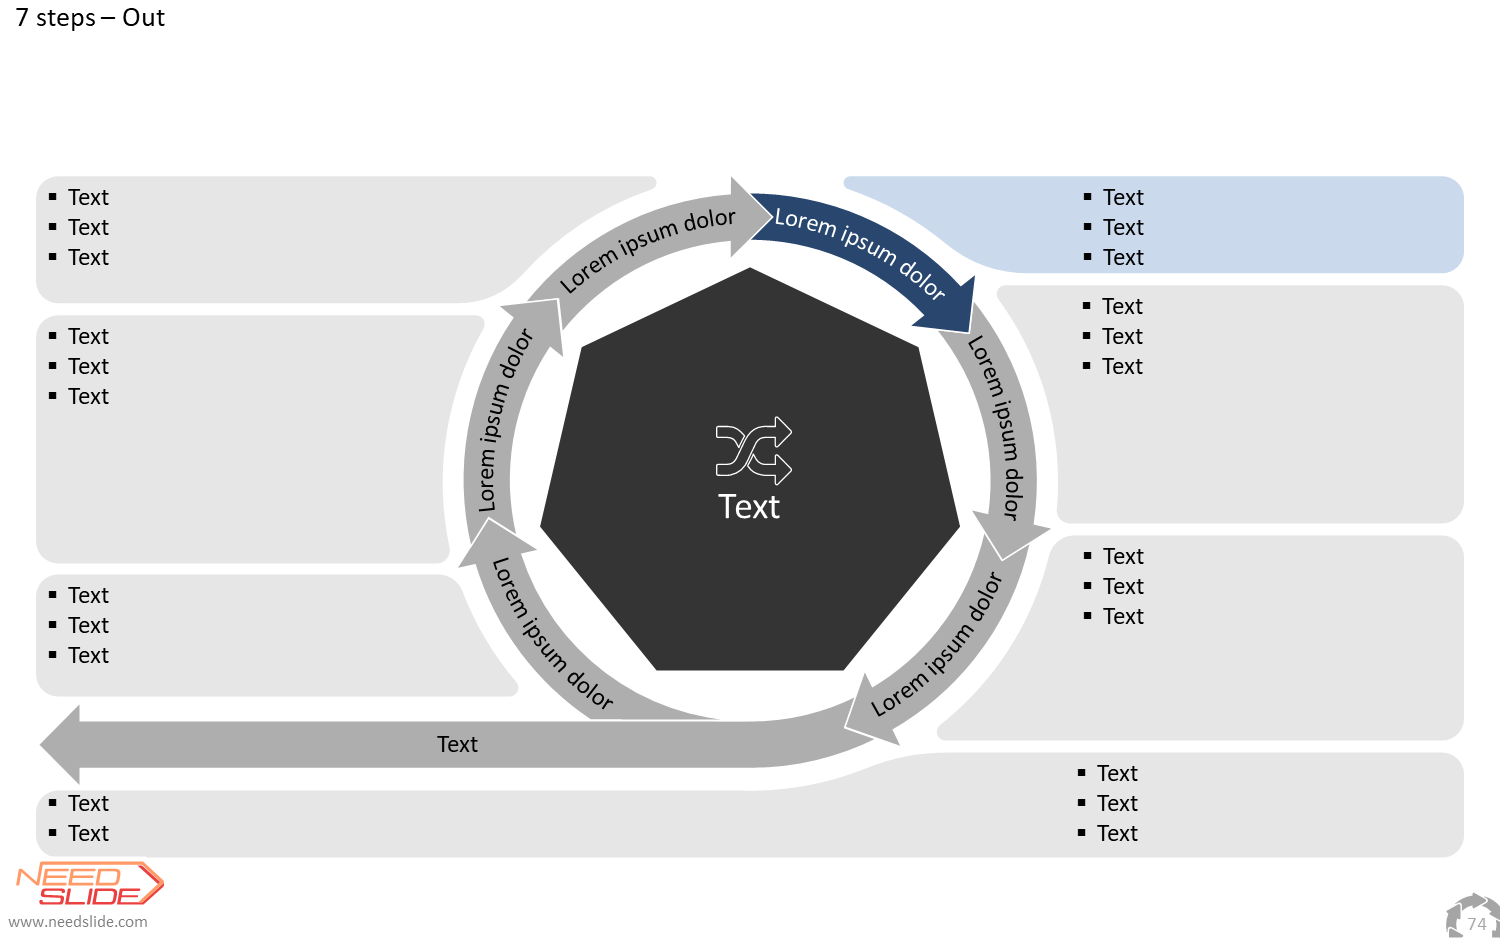
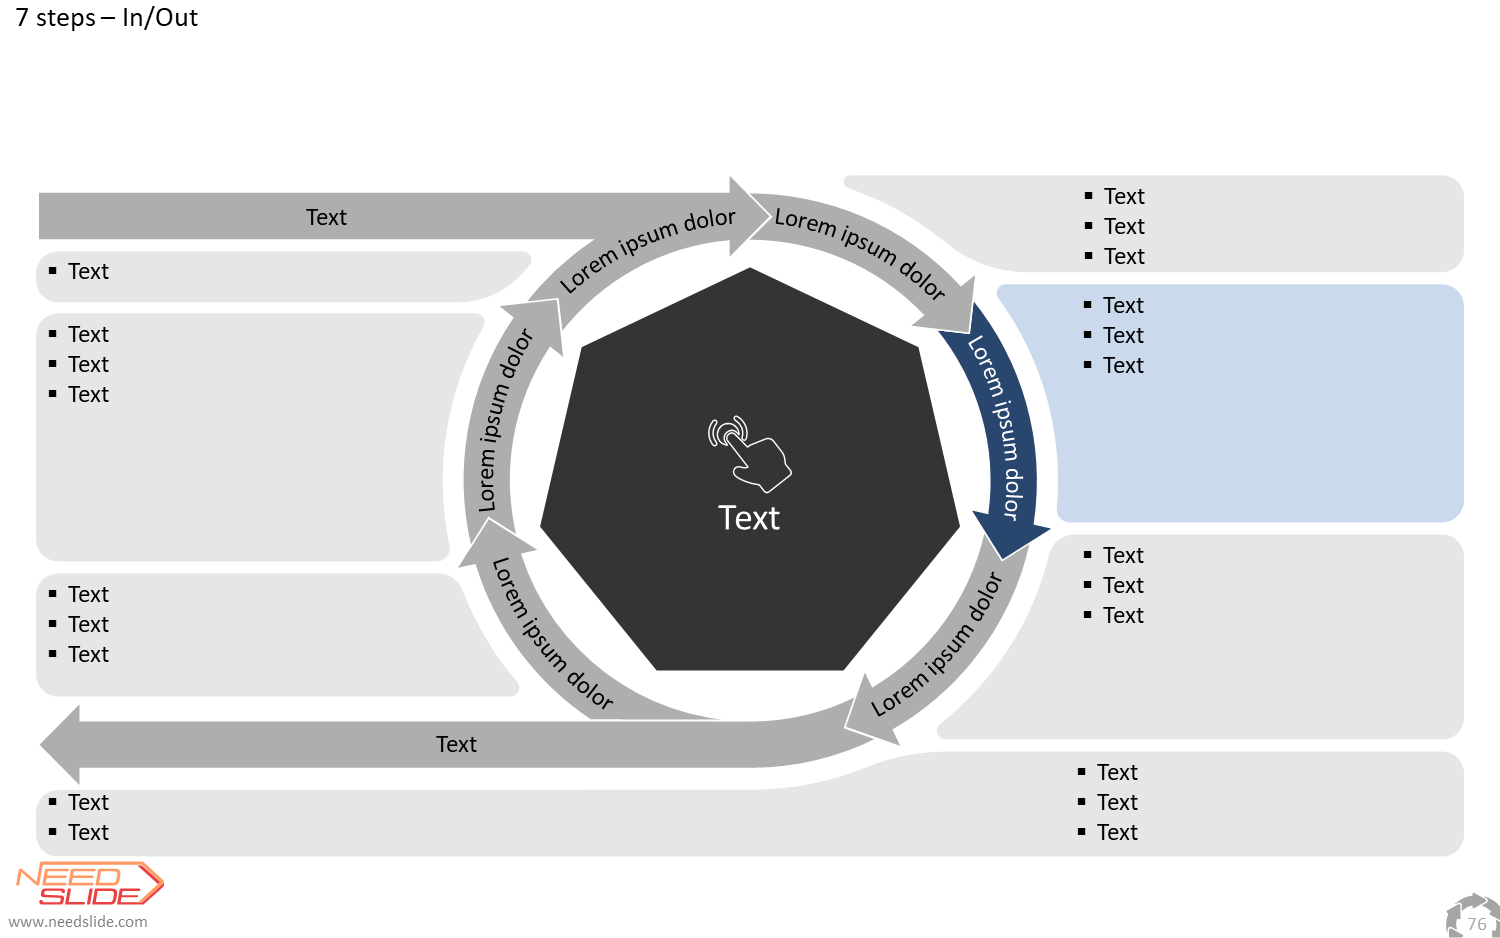
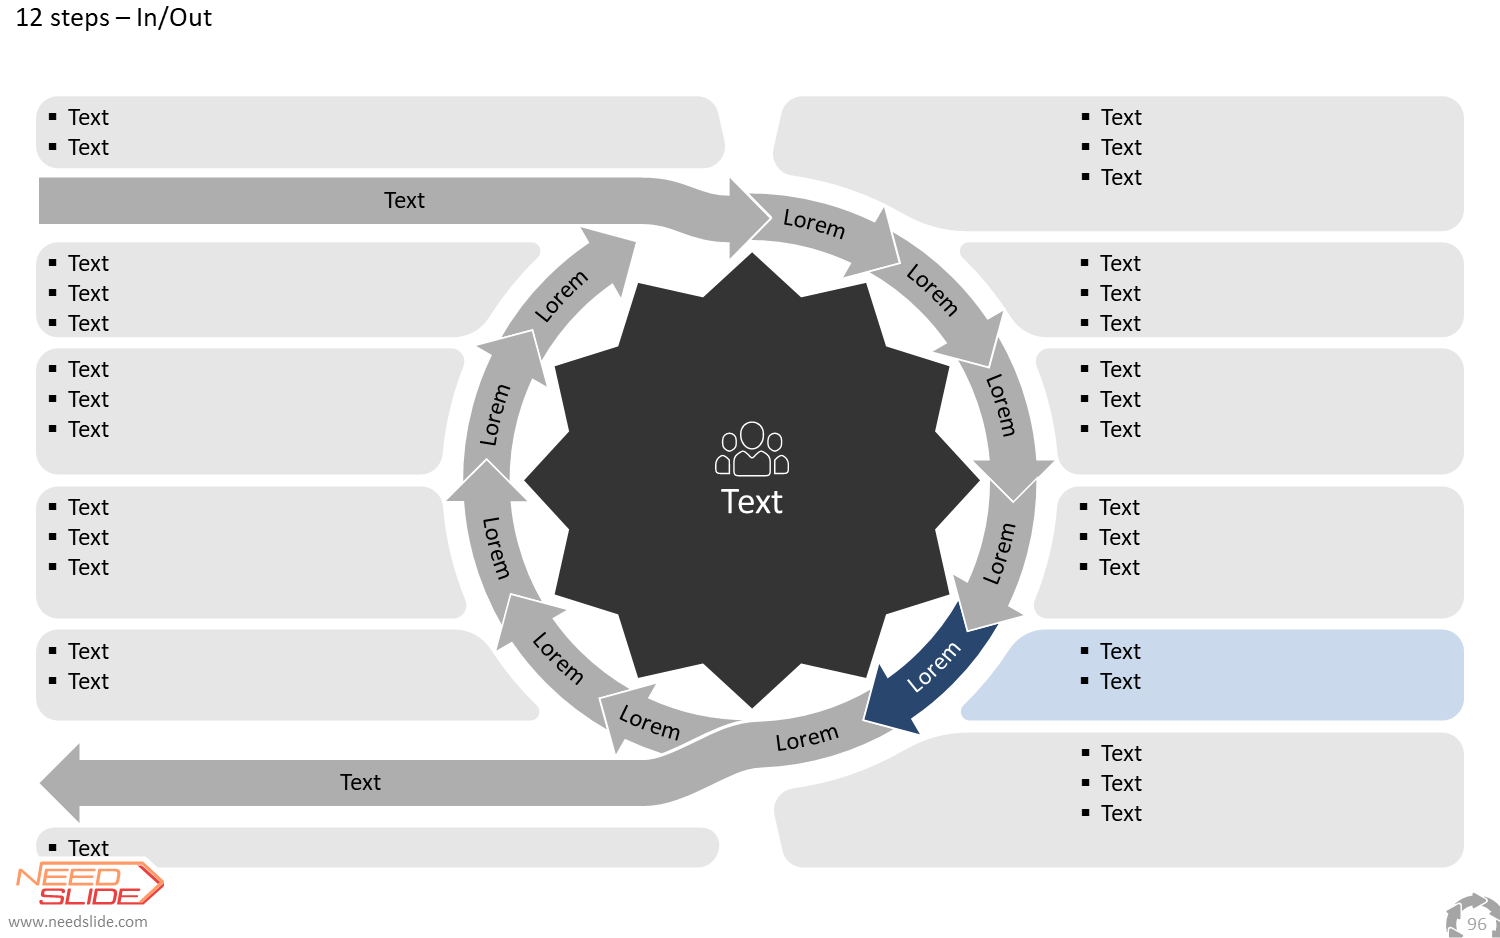
Now let’s imagine that there are incoming and outgoing events. For example, John’s friend Donny came to visit. Yes, there are such options in the cycle diagrams from NeedSlide (Standard and Premium):
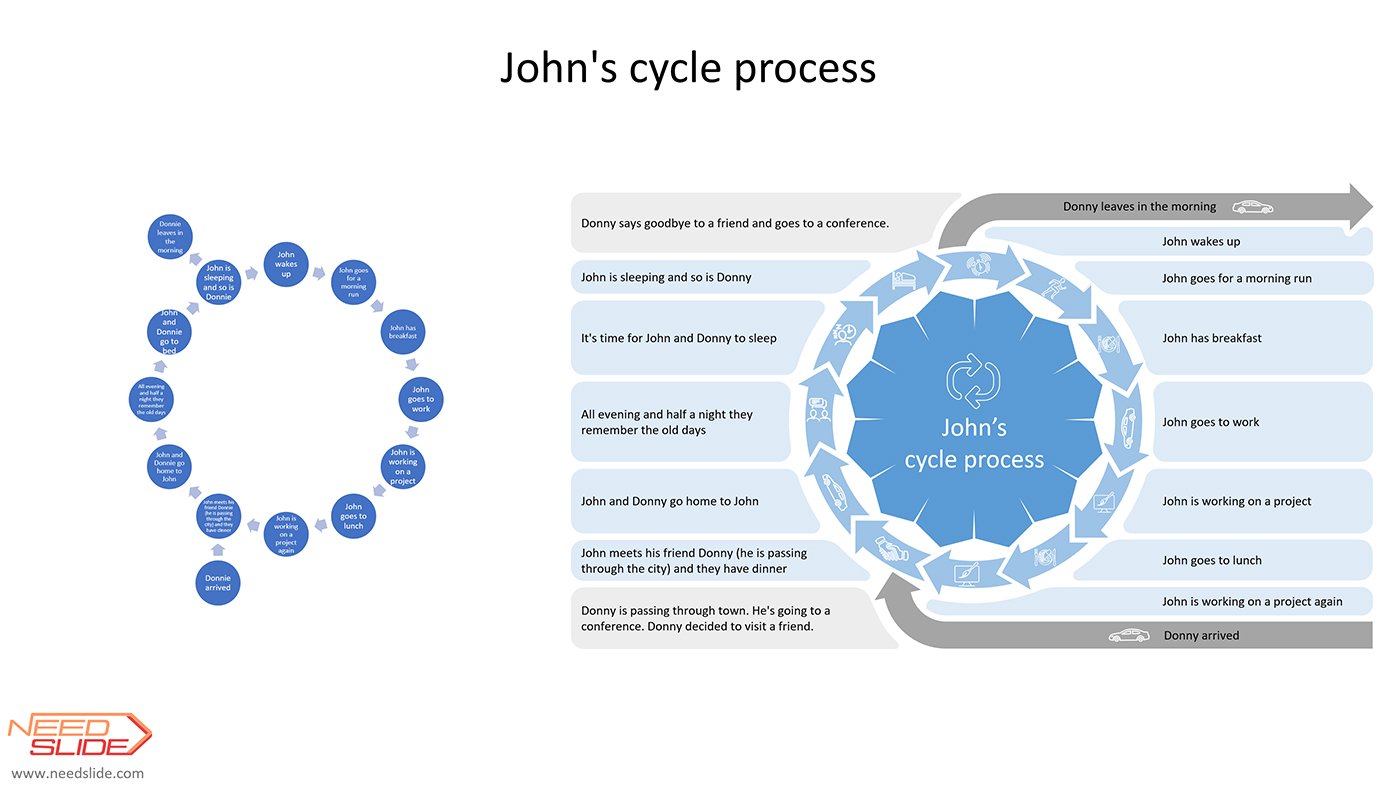
Note that call-out text not only provides an opportunity to describe each step in more detail and/or present its alternatives but can also act as a title for each step if necessary. See below for how to work with call-out text.
So, a cyclic process diagram is a visual representation of a closed and repetitive process that describes the actions (stages, steps) of this process, which has a consistent relationship between elements (steps, stages, actions) and direction. The direction of the cyclical process is important, because if there is no direction, then one step cannot go into the next step. If there is no transition (connection) between the steps of a cyclic process, then this is just a list of concepts (actions) that do not have a consistent connection, and if there is a connection (a sequence of steps), then there is a direction. It is important to emphasize that the cyclic process must not only be closed but must necessarily be repetitive. A cyclic process cannot be closed, but at the same time not repetitive, otherwise, its last step would not pass into its first step – in this case, we get the usual linear process, in whatever form it may be presented. So, we have four main properties of the Cyclic Process Diagram: closure, repetition, connection, and direction. These properties refer to the semantic component of the cyclic process, expressed through its visual component.
Closure – the cyclic diagram must be closed, i.e. there should be no breaks between steps (stages, stages, actions). If a break or breaks exist, then it is already a Process Diagram or some other type of diagram, but not a Cyclic Process Diagram.
Repetition – the cycle must be repeated. If it does not repeat, then this means that there is a break and there is no closure. When the last step turns into the first step, a new cycle begins: the first step again turns into the second step, the second step into the third, and so on.
Connection – the presence of a connection between the steps (stages, stages, actions) is a prerequisite. If there is no connection between the steps, then this means there is a break. A connection does not necessarily mean a causal relationship, a connection can also be a sequence of steps that do not follow from one to another, but simply occur in a certain sequence.
Direction – a sequence of steps (actions) performed in one direction. There cannot be two or more directions in a Cyclic Process Diagram, otherwise, it will no longer be a Cyclic Process Diagram. The direction may be given visually (eg, arrows or other visual means) and/or, for example, may be indicated by a sequence of numbers (a sequence of actions or steps).

In particular, the difference between the Cyclic Process Diagram and other types of diagrams that are visually similar to it depends on these properties. We will explore these differences in the next section.
How is Cyclic Process Diagram different from Process Diagram, Radial (Circular) Diagram, and Pie Chart?
The difference between Cyclic Process Diagram and Process Diagram is that Process Diagram is not a closed process. If everything is more or less clear with closure, then repetition should be analyzed in more detail. An ordinary linear process can be repetitive, but it is not closed, because there is no connection and/or causal relationship between the last and first steps of the process. Accordingly, there is no connection between the last and the first step, and the cycle is not closed.

The difference between Cyclic Process Diagram and the Radial (Circular) Diagram is more radical. A Radial (Circular) Diagram can be closed (more visually than in meaning), but does not repeat, has no connections (transitions) between elements (there are no steps, no sequence of actions, and no process as such), and has no direction. A Radial (Circular) Diagram in the form of a circle (it can be another figure) is a list of elements that have some common property or objects united according to some principle. There are cases when it is impossible to visually distinguish a Cyclic Process Diagram from a Radial (Circular) Diagram – only the semantic content of the diagram allows this to be done (or textual content, for example, in element names or text balloons).

The difference between Cyclic Process Diagram and Pie Chart is even more obvious. Pie Chart repeats all the properties of the Radial (Circular) Diagram with the only difference that its elements are fractions of a common whole.

Properties of Cyclic Process Diagram Elements
The main elements that makeup the Cyclic Process Diagram
The Cyclic Process Diagram consists of three main elements: the cycle step, the central element of the cycle, and the call-out text with additional information.
A cycle step can consist of a single object or a group of several objects. The cycle step can contain text elements. Text objects are optional for a cycle step. The cycle step is a required element of the Cyclic Process Diagram.

The central element of the cycle can also consist of a single object or a group of several objects. The central element of the cycle can also contain text elements. Text objects are optional for the central element of the cycle. The central element of the cycle is not a required element of the Cyclic Process Diagram.

The call-out text with additional information can also consist of one object or a group of several objects. Call-out text with additional information usually contains a text object or objects. The call-out text with additional information is not a required element of the Cyclic Process Diagram.

The aggregate of cycle steps can be considered as another element of the Cyclic Process Diagram because the aggregate of cycle steps has its properties slightly different from the properties of the cycle step.
Properties of cycle steps as a whole as an aggregate
Cycle shape
The shape of the cycle can be any. The main condition is that the cycle must be closed and must have a direction.

Cycle Direction
The direction of the cycle can be clockwise or counterclockwise. If the diagram shows several cycles, then they can have different directions.

Cycle Width (Height)
The cycle width can vary widely, but not more than the radius of the Cyclic Process Diagram. The width of the cycle can increase or decrease, and the width of the loop can be variable.

Cycle with incoming and/or outgoing elements
The cycle can have incoming and/or outgoing elements (steps, stages, actions). The joint of incoming and outgoing elements with the main cycle can have different visual solutions (see below for more details).

Cycle step properties
Step shape
The shape of the step can be very diverse. The shape of a step can itself show direction and create a link to other steps, but can also be visually separated with a start and/or end of a step that can link to other steps and/or indicate a direction. The presence of a visual representation of the connection with neighboring steps is mandatory and should be implied by the semantic content of the diagram. The direction may be indicated visually (e.g. by an arrow or some other articulation) or may be shown by a sequence of numbers, letters, icons, or pictures.

Start (input) and end (output) of a step (Steps connections shape)
The beginning and end of the step (Steps connections shape) can be integrated with the cycle step, but can also be visually separated from the cycle step. They serve as a link between the steps of the cycle and can have any form that does not contradict the semantic content of the diagram and the visual representation of the connection between the steps.

The direction of the step
The direction of the step completely coincides with the direction of the cycle as a whole.
Step Width
The width of the step can vary as well as the width of the cycle as a whole and with the same restrictions.
Incoming and/or outgoing steps
Incoming and/or outgoing steps (elements, actions, stages) can be visually represented in very different ways. Visually, the connection of incoming and/or outgoing steps with the main loop can be represented in several ways (see below).
Additional elements of the step
A cycle step can contain any additional elements – a vector icon, a bitmap image, a decorative element, a digital or letter designation of the step location in the sequence of cycle steps, etc.
Placing text inside a shape of the step or above a step shape
The text can be placed in the vector object of which the cycle step consists or in one (or several) of the vector objects that are part of the cycle step. Text can also be placed above the object (or objects) of the cycle step. Slides from NeedSlide make it easy to do this, even if the text is embedded in the object initially. See below for more information.
Properties of the central element/group of elements
The shape of the central element
The shape of the central element can be any and depend on the shape of the cycle.

Center element types
The central element can consist of one or more objects. The central element can contain text but can do without it. Also, the central element can be a decorative element of the diagram. In some cases, the central element can be used as a standalone Cyclic Process Diagram.

Numbering of the central element
The central element may contain numbering (or alphabetic characters) to indicate the sequence of steps of the cycle and its direction.

Additional objects of the central element
The central element can contain any additional objects – vector icons, bitmaps, decorative elements, etc.

Placement of text in and above the center element
The text can be placed in the vector object of which the central element consists of one (or several) of the vector objects that are part of the central element. Text can also be placed above the object (or objects) of the central element. Slides from NeedSlide make it easy to do this, even if the text is embedded in the object initially. See below for more information.
Properties of call-out text with additional information
The shape of call-out text with additional information
The call-out text with additional information can have any shape associated with the corresponding cycle step. It may consist of one or more objects.

Text placement
As a rule, rendered text with additional information should contain a text object or objects. Text can be embedded or placed above the callout.
Additional elements
Additional elements can be icons, illustrations, etc.
Working effectively with Cyclic Process Diagrams by NeedSlide
Working with Cyclic Process Diagrams from NeedSlide consists of several steps:
- Formulation of the problem. You should more or less understand what you want to get in the end. To do this, you need to know not only what the Cyclic Process Diagram will be about, but also some technical parameters: the number of steps, the direction of the cycle, the presence or absence of incoming/outgoing steps, the amount of text located in steps, the amount of text located in callouts, the presence of a central element and its content, etc. In addition, you must know the desired slide size and, preferably, the color palette.
- Finding the right product. If you know all the technical parameters, then choosing the right product using the filter will be very simple. You can choose the slide size (16 options) and color solution (several sets of color schemes from 7 to 28 color schemes in each set). You can also select a diagram by direction, step width (height), and design details (rounded corners or not, step connection shape, presence or absence of spaces between steps, etc.). If the number of steps changes during work, then this will not be a problem, because each Cyclic Process Diagram by NeedSlide contains a reasonable number of cycle step options. Also, if you add in/out steps, then this is also not a problem – NeedSlide’s Standard version of the Cyclic Process Diagram contains many input element options, and NeedSlide’s Premium version of the Cyclic Process Diagram contains many incoming/outgoing element options.
- Composition of Cyclic Process Diagram (if required). You can create a new diagram using individual elements from one or more products. For example, if you want the length of the steps to be different. Or if you need to replace the central element. Choose and assign a color scheme. All objects in NeedSlide products are assigned only the colors included in the palette – this means that changing the color scheme will always work without problems.
- Filling the Cyclic Process Diagram with content. You type or copy text into a diagram. And also, if required, use icons, illustrations, and other additional elements.
- Transferring a slide with Cyclic Process Diagrams to your presentation (if required). You could move the Cyclic Process Diagram before or immediately after the composition step, but we recommend doing this as the last turn. Read below to learn how to transfer a Cyclic Process Diagram from a NeedSlide presentation to your presentation.
Useful information and some practical tips
If you know in advance how much text you will fill in the cycle step shapes, the central element, and call-out text, then it will be very easy to choose the shape and design of these elements. For example, if you want the steps of the cycle in the form of an arrow, then it is obvious that an arrow with a larger angle (120°) will allow you to place a little more text than an arrow with a smaller angle (60°). It is also obvious that a chart with a larger step height (width) will allow more text to fit.

If the text was originally embedded in the vector object, then it can be deleted and a new text box created to place it on top of the vector object.
And vice versa, if the text is placed on top of the vector object, then this text can be deleted, and the text can be embedded in the vector object.
Embedded text can be aligned relative to the vector object it is embedded in. For this, the internal margins of the vector object are used. By editing the margins values, you can place the text anywhere relative to the vector object, including outside the boundaries of the vector object. This method is used in many situations: in a single vector object, in a group of objects, when text is embedded in one or more objects that are part of a group, in diagrams, it is very widely used in vector maps, etc.
Our product The Best World Map for PowerPoint uses groups of text objects both above the objects and as embedded text. You can also get a look at our product Flags and Flags Icons containing a variety of vector flags of the highest quality.
The call-out texts with additional information in our Cyclic Process Diagrams contain embedded text. Text in call-out text with additional information to the left of the diagram is left-aligned. The text in call-out text with additional information to the right of the diagram is aligned along a common line with appropriate margin indents. For each call-out text, the fields are configured individually. If you wish, you can also align the text in this call-out text to the left.
In some call-outs, the top and/or bottom call-out text contain two-column text. You can change the parameters of these columns (for example, the spacing between columns) or make the text into one column.
If a vector object has a non-standard shape, then embedding large amounts of text into it can cause difficulties for an inexperienced user. But this is quite easy to do using various methods. For example, setting margins, using a line break, setting object filling with text, setting vertical and horizontal alignment, setting line spacing, etc. For example, in a complex shape object, you can embed text on two lines using a line break (Shift + Enter).
When creating Cyclic Process Diagrams, we used several different options for jointing in/out elements with the steps of the cyclic process. If you did not find the option you need and/or you need a special joint option, then use our Creation of a non-standard and/or complex Cyclic Process Diagram service and describe in the task (illustrate with a picture) the joint option which you need along with a general description of your diagrams.

Additional vector backgrounds are built into the presentation as Slide Master layouts. Therefore, they are very easy to select and assign. The backgrounds are very simple and fully vector, so they are easy to edit.
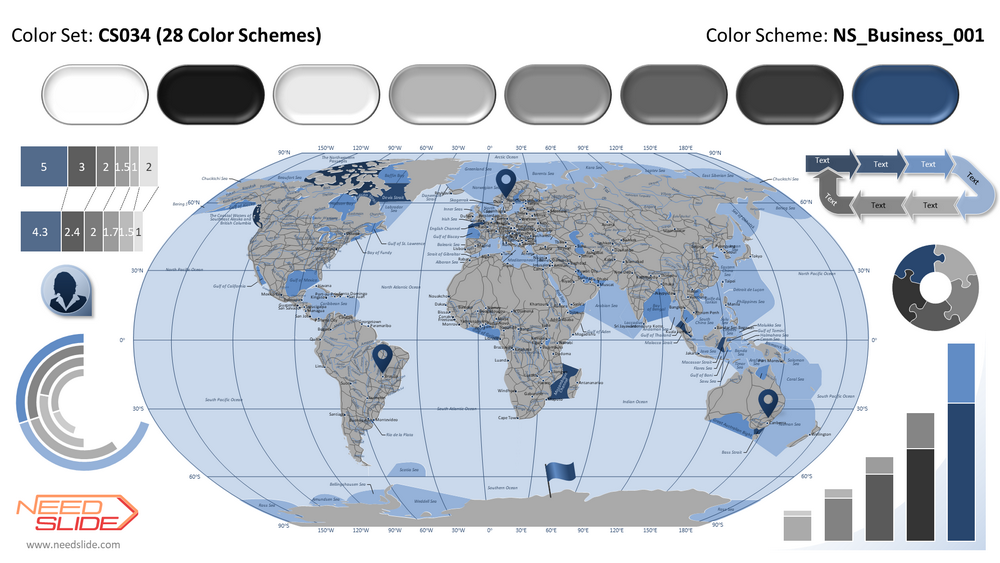
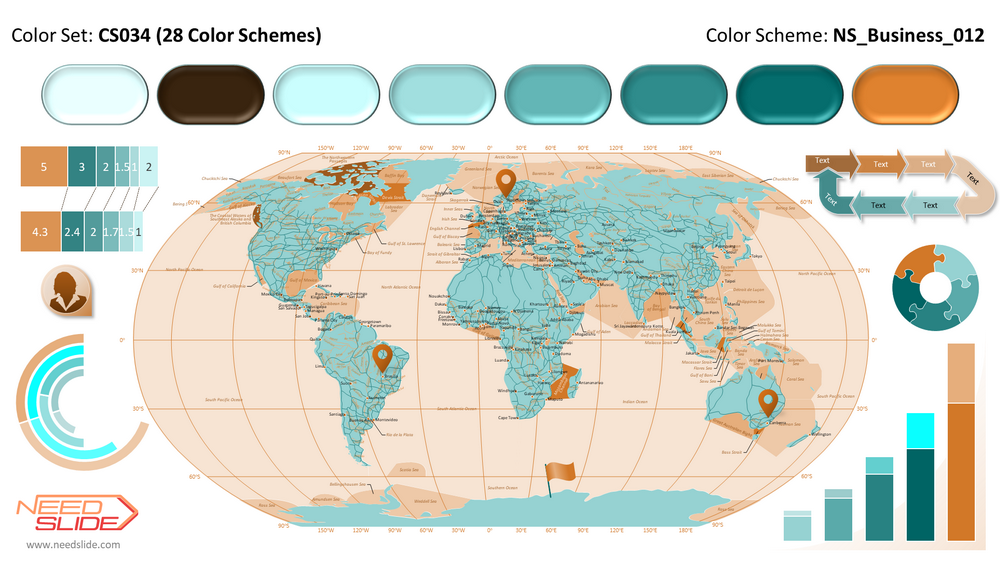
The built-in Color Scheme determines the color scheme of the entire presentation or individual slides. But only if the presentation uses only colors from the palette (theme colors). Palette colors (theme colors) are based on the colors of the Color Scheme. That is, if each object is assigned a fill color and an outline color from the palette colors (theme colors). Only in this case, replacing the Color Scheme will replace all colors in the presentation or on the selected slides. If objects are assigned colors outside the palette (theme colors), then changing the Color Scheme will have no effect. You can use this property if you want the colors of some objects (for example, vector logos) to remain the same when applying any Color Scheme. To do this, assign colors outside the palette (theme colors) to such objects.

Almost all products from NeedSlide have several built-in Color Schemes. These Color Schemes are not installed on the system (but you can choose a color scheme from our catalog and install it on your Windows system). If a Color Scheme is installed on this system, on this computer or laptop, it is only available on this system. But in our products, Color Schemes are built directly into the presentation file. Therefore, when opening a presentation on any desktop or laptop, all built-in additional Color Schemes will be available.
Selecting and assigning built-in Color Schemes is very easy. You can apply a color scheme to the entire presentation or just selected slides. Thus, several Color Schemes can be used simultaneously in one presentation. This can be useful, for example, for different color designs of sections in a presentation, or, for example, for different color designs of presentations of different departments of a company, etc.
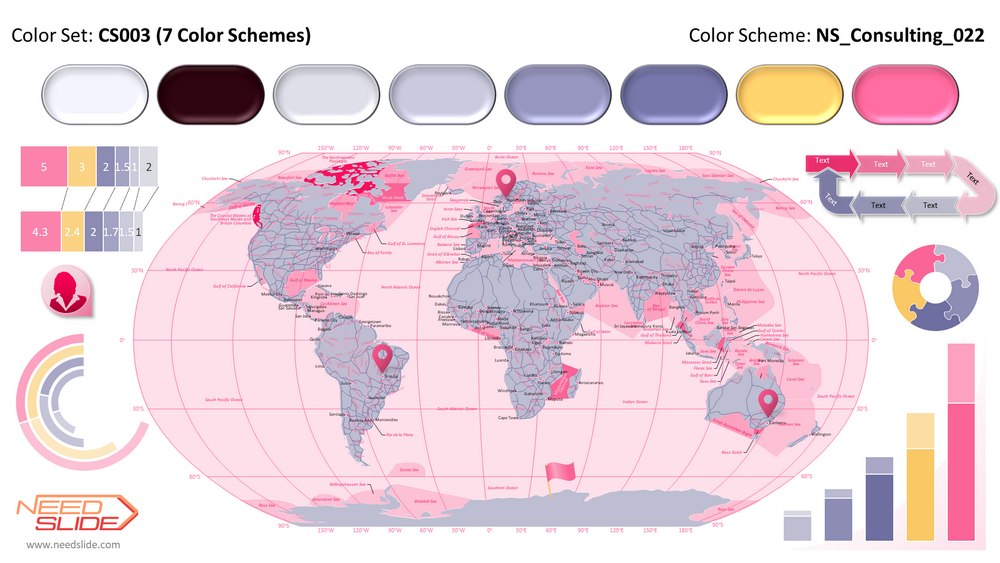
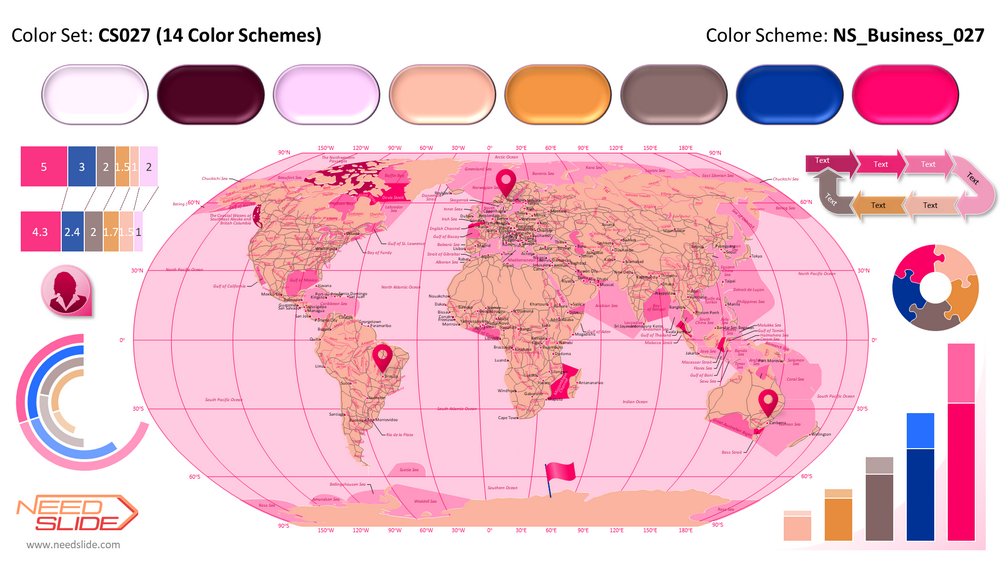
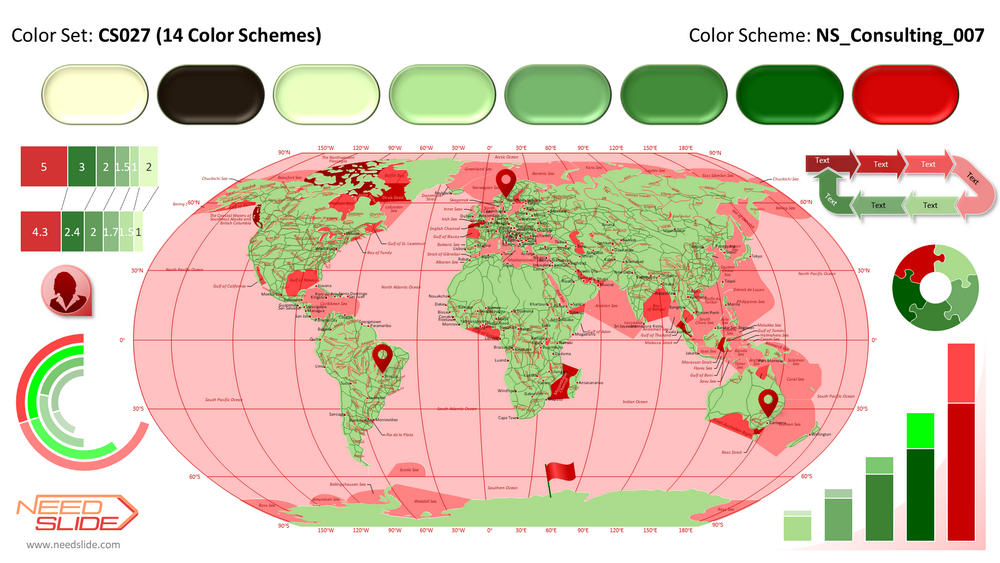
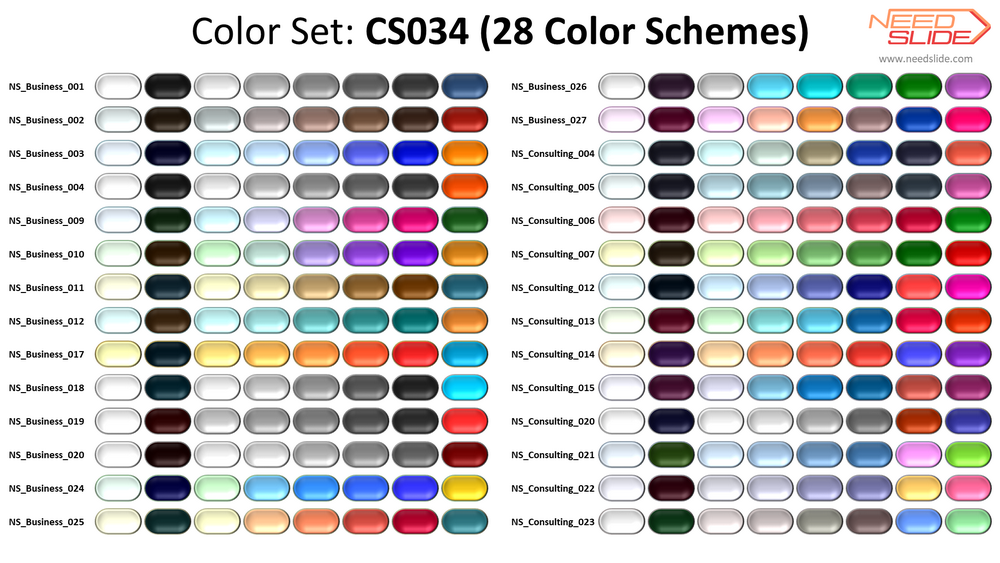
NeedSlide has created an extensive catalog of Color Schemes (181 Color Schemes). Among them are Color Schemes specially designed for business applications in general, for consulting (considering that in consulting a presentation is often a report and one slide can contain a lot of data, tables, and charts), and Color Schemes based on the colors of famous paintings, films, special color schemes for maps, etc. Our catalog of Color Schemes includes schemes with one, two, or more accents, monochromatic, complementary (dual), analogous, triadic, tetradic, etc.
There are 7 to 28 Color Schemes built into every presentation with Cyclic Process Diagrams. These are Color Scheme sets. Each set has its name, as well as each Color Scheme included in this set.
 |
| |||||||


 |
| ||||||||||||||


 |
|


NeedSlide offers you 16 slide sizes.

If this is not enough, then you can order the Changing the size of the slides service from us.
There are three options for Importing slides from NeedSlide into your presentation:
1.You can use the presentation from NeedSlide as the basis for your presentation. In this case, the template and all its layouts (backgrounds) will be saved in your presentation. All built-in Color Schemes will also be saved. In this way, the presentation from NeedSlide becomes your presentation and you can use it to create your slides using all the benefits of products from NeedSlide.

2.You can import a single slide with the Cyclic Process Diagram into your presentation. In this case, options are possible. If you transfer a slide with the same aspect ratio as the aspect ratio of the slides in your presentation, then the Cyclic Process Diagram aspect ratio does not change when transferring (only the size of the Cyclic Process Diagram can change if the slide size of your presentation does not match the slide size from NeedSlide). If you transfer a slide whose aspect ratio does not match the aspect ratio of your presentation, then PowerPoint will automatically scale the transferred slide according to the Ensure Fit algorithm, i.e. will fit the content of the slide to the size of your slide without going beyond its borders. And in this case, the proportions of the Cyclic Process Diagram will not change.
You can insert a NeedSlide slide into your presentation using two insert options:
- You paste a slide in the format of your presentation (Use Destination Theme). The colors of the Cyclic Process Diagram will change. The Cyclic Process Diagram will be in the colors of your presentation palette. In this case, the built-in backgrounds and Color Schemes will not be transferred to your presentation.
- You paste a slide in NeedSlide presentation format (Keep Source Formatting). The colors of the Cyclic Process Diagram will not change. The Cyclic Process Diagram will be in the colors of the NeedSlide presentation. This makes all the built-in backgrounds and built-in Color Schemes part of your presentation. Since embedded backgrounds are template layouts, they will become a new additional template (Slide Master) in your presentation and will only touch the inserted slide. Your presentation template (Slide Master) or templates (Slide Masters) will remain the same for the rest of the slides in your presentation. You can also assign layouts (backgrounds) from the new template (Slide Master) to other slides in your presentation. The same goes for Color Schemes – they will also be available for the inserted slide and can be available for your other slides if you assign them (apply the theme from NeedSlide) one of the layouts (background) of the new template.

3. You can transfer the Cyclic Process Diagram itself to your presentation (not the entire slide, but only the diagram). You can select the entire Cyclic Process Diagram and transfer the Cyclic Process Diagram itself to your presentation, and not the entire slide. In this case, scaling will not occur and you may need to scale the Cyclic Process Diagram yourself (don’t forget to group all the diagram objects before scaling). Otherwise, everything will be the same as in the second option – if you insert a Cyclic Process Diagram using Use Destination Theme, then backgrounds and themes will not be transferred to your presentation, and if you insert a Cyclic Process Diagram using Keep Source Formatting, then all backgrounds and colors the diagrams will be transferred to your presentation and an additional template will appear in your presentation – the template (Slide Master) from NeedSlide. And just like that, you can assign this template (or this theme) to other slides in your presentation. We consider this option the most optimal in terms of capabilities and flexibility of use.

Cyclic Process Diagram by NeedSlide contains several free vector icons. These are icons of the Filled Lines type, they are one-color and consist of one object, i.e. they do not have contour lines and their color can be changed using a fill. These icons are fully vector and do not lose quality when scaled. If you need high-quality vector icons of various types (Lines, Filled Lines, Filled Objects) and designs, then check out our Vector Icons catalog section.

 2245
2245
 2225
2225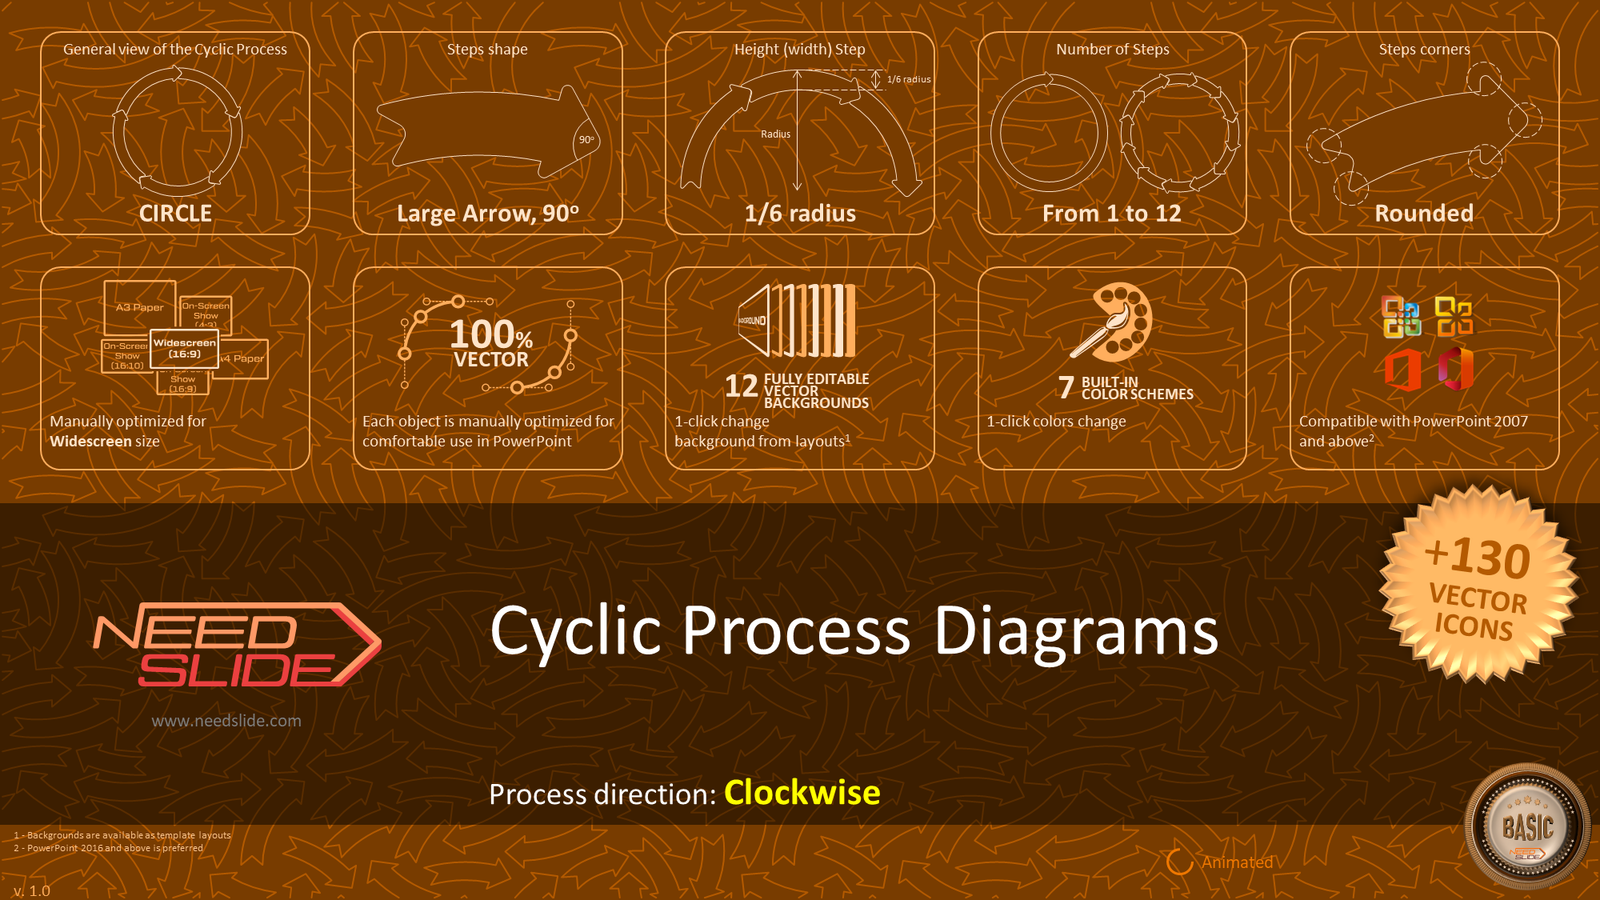
 2229
2229
 2230
2230
 2228
2228
 2248
2248
Reviews
There are no reviews yet.